
Figures & data
Figure 1. Prisma flow chart explaining stages of meta-analysis.
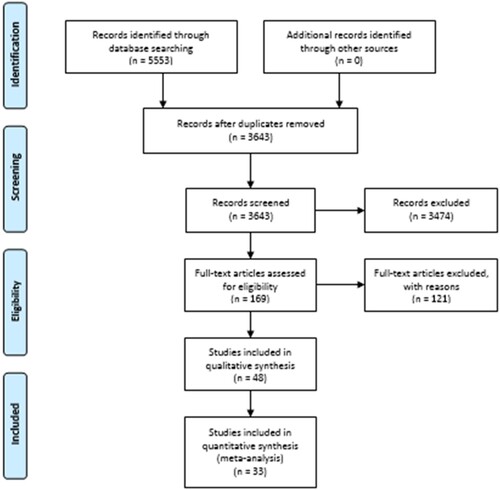
Table 1. Summary of evidence from the systematic review.
Table 2. Mean values and CIs for Controls and LD.
Figure 2. Forest plot indicating the performance difference between controls and LDs in dichotic CV test.
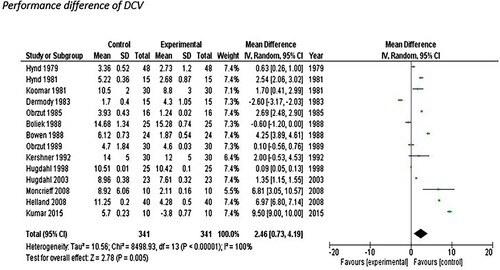
Figure 3. Forest plot indicating the performance difference between controls and LDs in dichotic digit test.
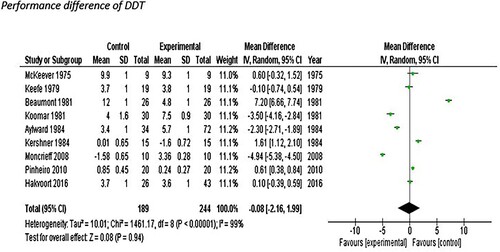
Figure 4. Forest plot indicating the right ear performance difference between controls and LDs in dichotic CV test.
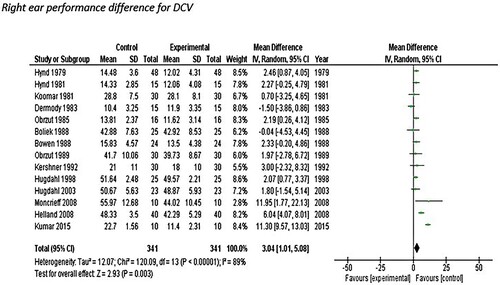
Figure 5. Forest plot indicating the right ear performance difference between controls and LDs in dichotic digit test.
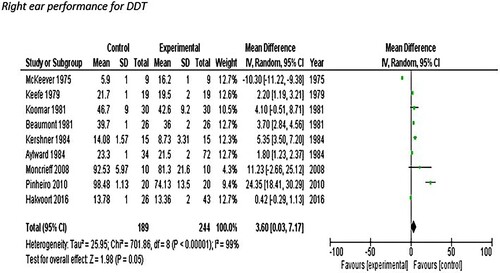
Figure 6. Forest plot indicating the left ear performance difference between controls and LDs in dichotic CV test.
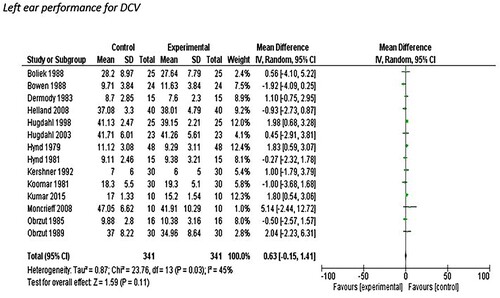
Figure 7. Forest plot indicating the left ear performance difference between controls and LDs in dichotic digit test.
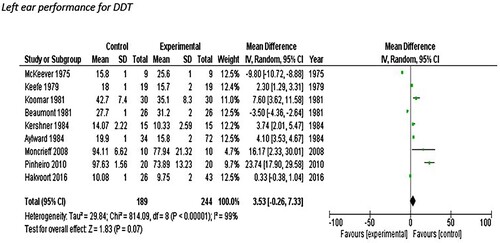
Figure 8. Forest plot indicating the right directed attention performance difference between controls and LDs in dichotic CV test.
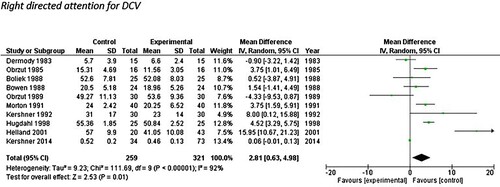
Figure 9. Forest plot indicating the right directed attention performance difference between controls and LDs in dichotic Digit test.
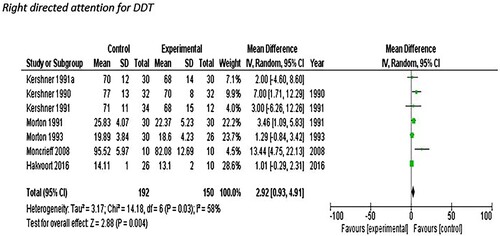
Figure 10. Forest plot indicating the left-directed attention performance difference between controls and LDs in dichotic CV test.
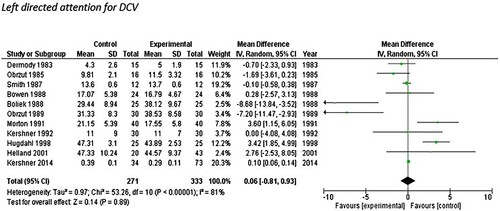
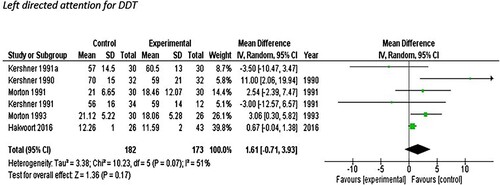
Figure 11. Forest plot indicating the left-directed attention performance difference between controls and LDs in dichotic digit test.
Data availability statement
The data is available with the corresponding author and will be shared on request.