
Figures & data
Table 1. Correlations between oral and written retell measures.
Table 2. Correlations between retell and other literacy measures.
Table 3. Hierarchical linear regression for written narrative retell.
Table 4. Demographics of groups based on number of words produced in each retell.
Table 5. Results for group differences.
Figure A1. Qualitative Scoring Tool.
Note: Adapted from Mackenzie et al. (Citation2013) and Scull et al. (Citation2020).aResearcher adaptations.
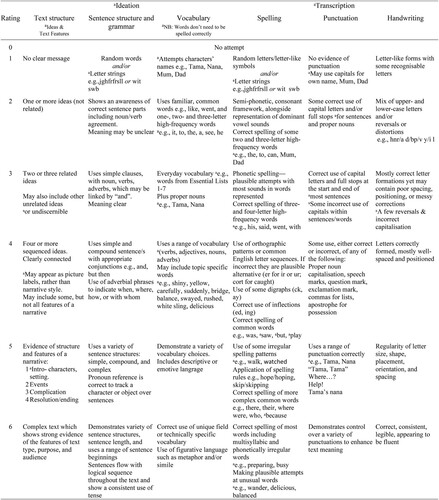
Figure A2. Curriculum-based Measures (CBM) adapted from Jewell and Malecki (Citation2005).
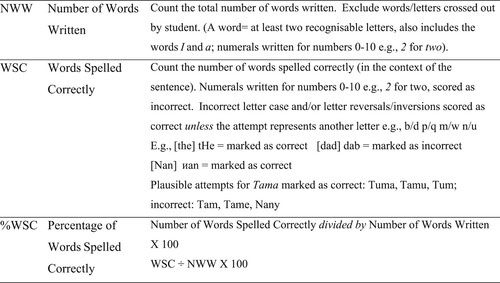
Figure A3. Oral and written retell comparison for a child representative of the mean.
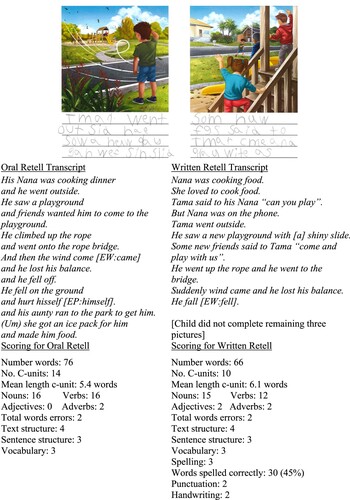
Table B1. Descriptive statistics.
Table B2. Paired samples correlations comparing oral & written retells.
Figure B1. Distributions of retell and literacy measures.
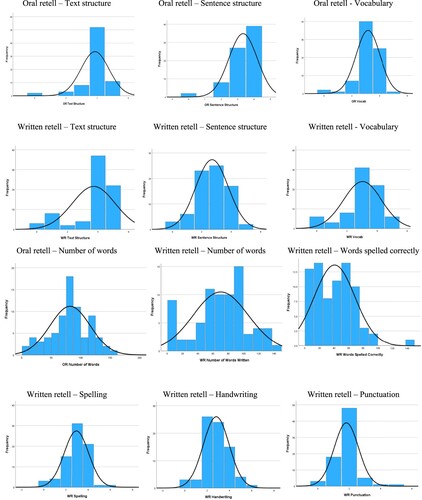
Figure B1. Continued.
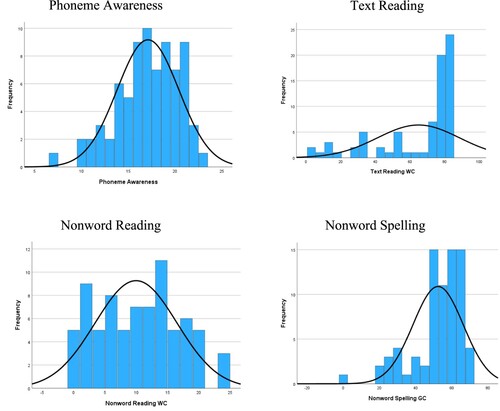
Table B3. Descriptive statistics for groups 1–4.
Table B4. Post hoc test group comparisons for retell and other literacy measures.