
Figures & data
Figure 1. Preferred reporting items for systematic reviews and meta-analyses (PRISMA) flow chart for study selection. RCT, randomised controlled trial.
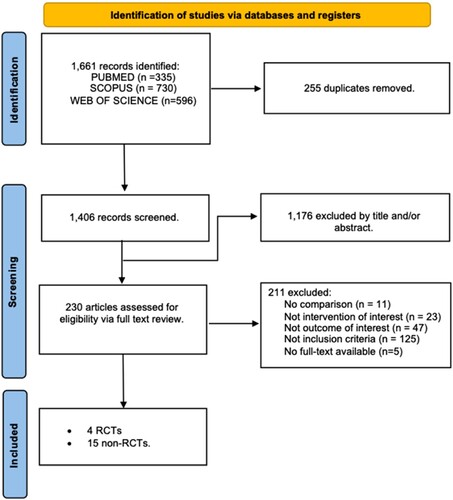
Table 1. Characteristics of studies included in the meta-analysis.
Figure 2. A detailed description of the ROB assessment for RCTs.
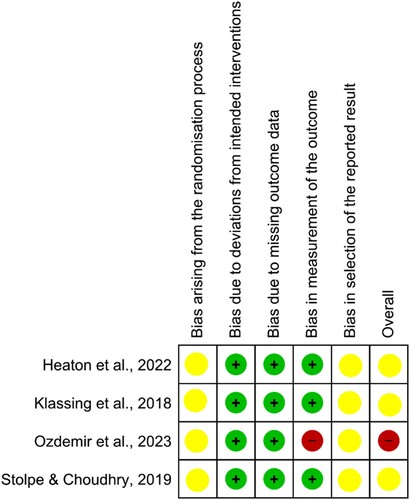
Figure 3. Summary plot of ROB assessment for RCTs.
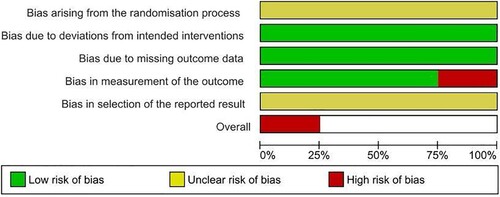
Figure 4. A detailed description of the ROB assessment for non-RCTs.
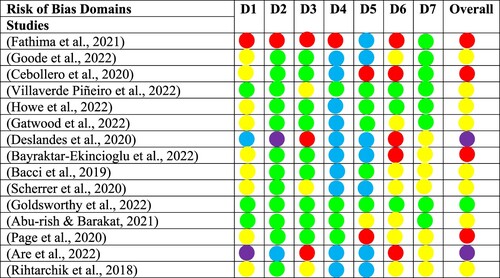
Figure 5. Summary plot of ROB assessment for non-RCTs.
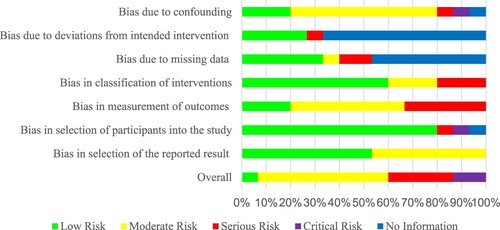
Table 2. Summary of analyses of the impact of pharmacist interventions on immunisation uptake.
Figure 6. Overall impact of pharmacist’s involvement on immunisation uptake.
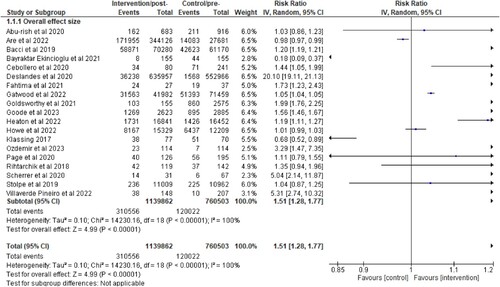
Figure 7. Subgroup analysis on the impact of pharmacist intervention on immunisation uptake according to their roles as immunisers, advocators, or both.
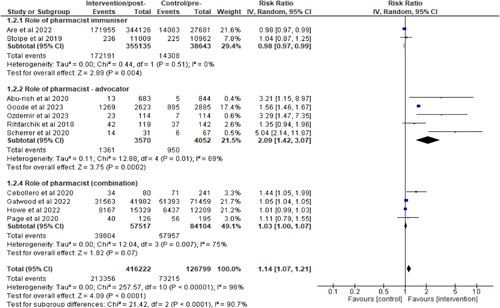
Figure 8. Subgroup analysis of the impact of pharmacist interventions on immunisation uptake according to setting (hospital, community, or institution).
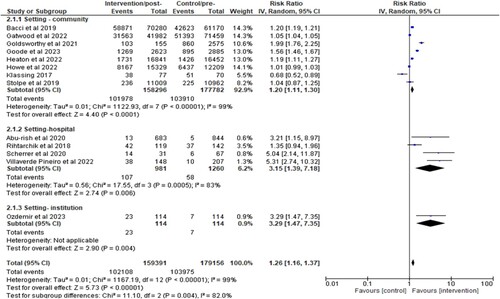
Figure 9. Funnel plot demonstrating the presence of publication bias (overall effect size).
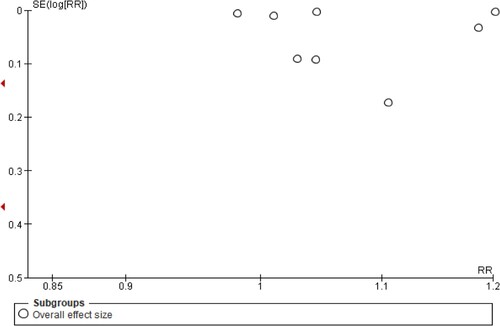
Figure 10. Funnel plot demonstrating the presence of publication bias (subgroup analysis of pharmacist roles).
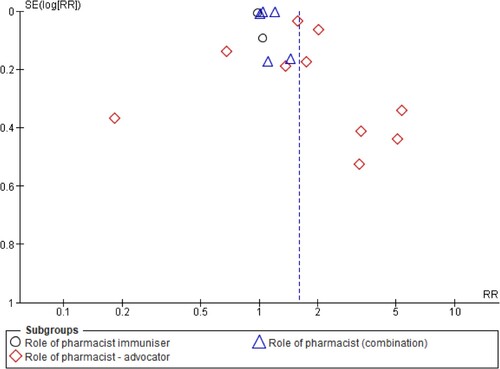
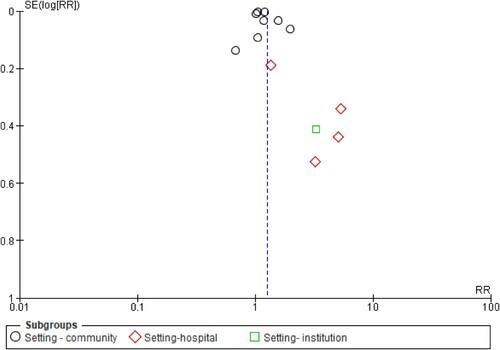
Figure 11. Funnel plot demonstrating the presence of publication bias (subgroup analysis of study setting).
Supplemental Material
Download MS Word (301.9 KB)Data availability statement
The data that support the findings of this study are available in the supplementary material section of this article.