
Figures & data
Figure 1. Markov transition-state model diagram. This chart displays the various health conditions that a patient can experience within the Markov transition-state model. The arrows indicate the possible changes in the patient's health status. The patients are susceptible to several risks, including recurrent deep vein thrombosis (DVT), recurrent pulmonary embolism (PE), intracranial haemorrhage (ICH), non-ICH major bleeding (MB), clinically relevant non-major bleeding (CRNMB), and death. All death states are self-absorbing.
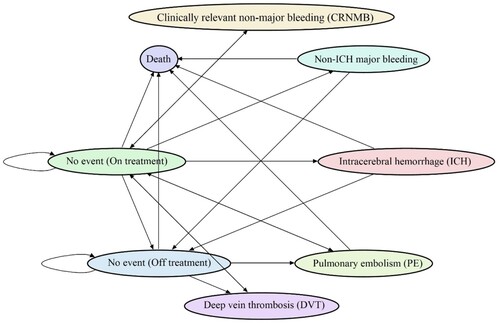
Table 1. Base-case analysis results for a 5-year time horizon.
Figure 2. One-way deterministic sensitivity analysis over a 5-year time horizon. LMWH: low-molecular-weight heparins; PE: pulmonary embolism; DOACs: direct oral anticoagulants; ICH: intracranial haemorrhage; MB: major bleeding; DVT: deep vein thrombosis; EV: expected value; ICER: incremental cost-effectiveness ratio; USD: United States dollars; WTP: Willing-To-Pay.
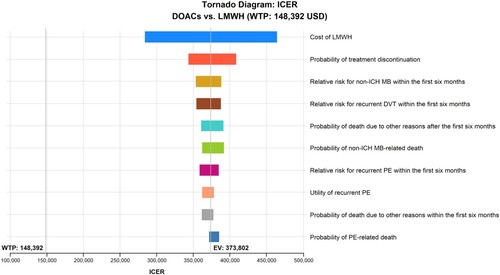
Figure 3. Probabilistic sensitivity analysis over a 5-year time horizon. DOACs: direct oral anticoagulants; LMWH: low-molecular-weight heparins; USD, United States dollars; WTP: Willingness-To-Pay; ICE: Incremental cost-effectiveness. Spots represent 10,000 draws of the probabilistic analysis, and the vertical dotted line represents the WTP limit. Values of blue pentagonal spots on the right side of the WTP line are considered dominant or cost-effective.
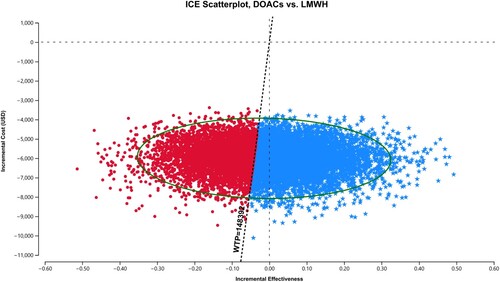
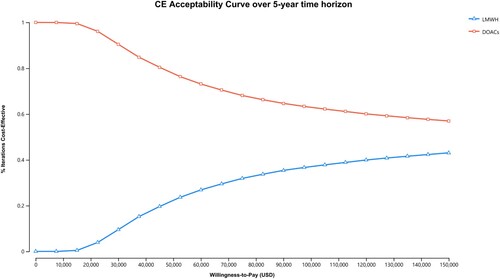
Figure 4. Acceptability curves for DOACs and LMWH over a 5-year time horizon. DOACs: direct oral anticoagulants; LMWH: low-molecular-weight heparins; USD, United States dollars; CE: cost-effectiveness.
Suppl_CEA_CAT_v18_tracked cleaned.docx
Download MS Word (301.2 KB)Data availability statement
All data generated or analysed during this study are included in this published article and its supplementary information files.