1,190
Views
18
CrossRef citations to date
0
Altmetric
Research Article

Fabrication of biocomposites composed of natural rubber latex and bone tissue derived from MC3T3-E1 mouse preosteoblastic cells

, & ORCID Icon
Pages 76-83 | Received 23 May 2017, Accepted 03 Jul 2017, Published online: 20 Jul 2017

Figures & data

Table 1 Validated primer sequences for RT-PCR

Figure 1 (a) Zeta potential vs. pH of NRL and NRL-HA nanoparticles in water (0.01 wt.%). For comparison, the precipitated HA without NRL particles is shown (0.01 wt.%). Results are expressed as mean ± S.D. (Standard deviation) (n = 5). (b) Particle size distribution with PDI of NRL and NRL-HA after biomineralization at concentration of 0.01 wt.% at pH 7.4
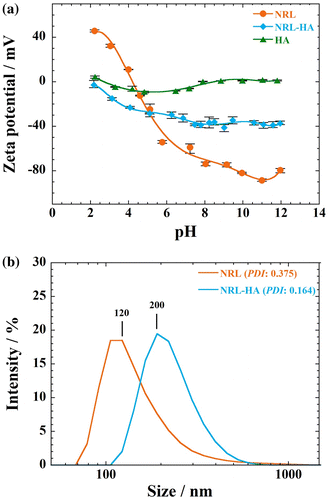
Figure 1 (a) Zeta potential vs. pH of NRL and NRL-HA nanoparticles in water (0.01 wt.%). For comparison, the precipitated HA without NRL particles is shown (0.01 wt.%). Results are expressed as mean ± S.D. (Standard deviation) (n = 5). (b) Particle size distribution with PDI of NRL and NRL-HA after biomineralization at concentration of 0.01 wt.% at pH 7.4

Figure 2 FE-SEM images showing NRL-HA nanoparticle at concentration of 10−4 wt.%: (a) discrete particle and (b) small discrete particle with coarse surface
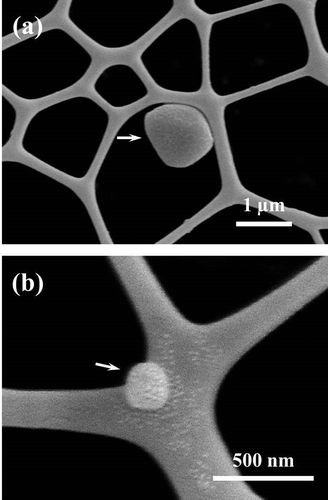
Figure 2 FE-SEM images showing NRL-HA nanoparticle at concentration of 10−4 wt.%: (a) discrete particle and (b) small discrete particle with coarse surface

Figure 3 TGA curves, derivative analysis (DTG) and DTA of (a), (b) pristine NRL nanoparticles, and (c), (d) NRL-HA nanoparticles
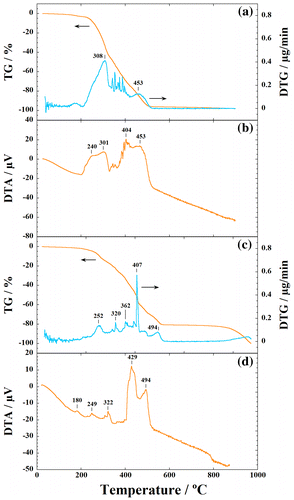
Figure 3 TGA curves, derivative analysis (DTG) and DTA of (a), (b) pristine NRL nanoparticles, and (c), (d) NRL-HA nanoparticles

Figure 4 FTIR image of NRL-HA nanoparticles after biomineralization obtained from the selected 200 × 200 μm2 area (left panel). FTIR spectra of corresponding five constituents (a)–(e) by plotting PCA (right panel) in the region of 4000–680 cm−1
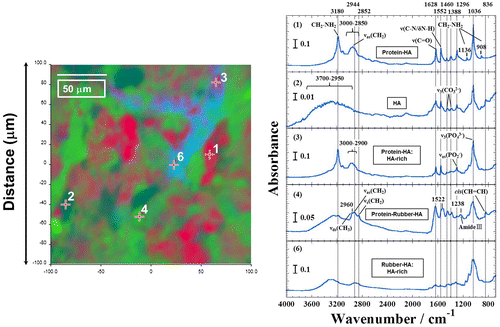
Figure 4 FTIR image of NRL-HA nanoparticles after biomineralization obtained from the selected 200 × 200 μm2 area (left panel). FTIR spectra of corresponding five constituents (a)–(e) by plotting PCA (right panel) in the region of 4000–680 cm−1

Figure 5 Cell viability as measured by WST-8 assay using (a) MC3T3-E1 and (b) A549 cells after 24 h of incubation with NRL and/or NRL-HA nanoparticles of different concentrations. Data were expressed as mean ± S.D. (n = 5)
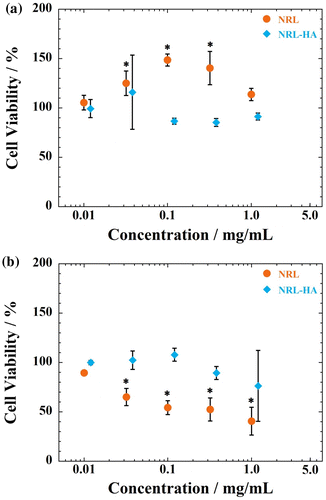
Note: *indicates p < 0.05 compared with control
Figure 5 Cell viability as measured by WST-8 assay using (a) MC3T3-E1 and (b) A549 cells after 24 h of incubation with NRL and/or NRL-HA nanoparticles of different concentrations. Data were expressed as mean ± S.D. (n = 5)

Figure 6 RT-PCR analysis of the osteogenic gene expression of (a) Runx2, (b) Sp7/Osterix, (c) Alp, and (d) Bglap for MC3T3-E1 cells cultured with NRL nanoparticles of 1.0 mg/mL and/or NRL-HA nanoparticles of 1.0 mg/mL at different time intervals (3, 10, and 20 days). Data were expressed as mean ± S.D. (n = 3)
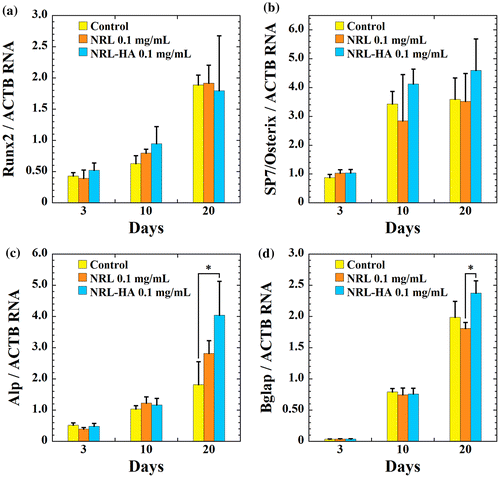
Note: *indicates p < 0.05 compared with control (Student’s t-test)
Figure 6 RT-PCR analysis of the osteogenic gene expression of (a) Runx2, (b) Sp7/Osterix, (c) Alp, and (d) Bglap for MC3T3-E1 cells cultured with NRL nanoparticles of 1.0 mg/mL and/or NRL-HA nanoparticles of 1.0 mg/mL at different time intervals (3, 10, and 20 days). Data were expressed as mean ± S.D. (n = 3)

Figure 7 (a) Alizaline staining and (b) qualitative evaluation of calcium deposition by MC3T3-E1 cells cultured with different NRL nanoparticle concentrations (0.10, 0.32, and 1.0 mg/mL) after 20 days. (c) Alizaline staining and (d) qualitative evaluation of calcium deposition by MC3T3-E1 cells cultured with different NRL-HA nanoparticle concentrations (0.10, 0.38, and 1.2 mg/mL) after 20 days. Data were expressed as mean ± S.D. (n = 4)
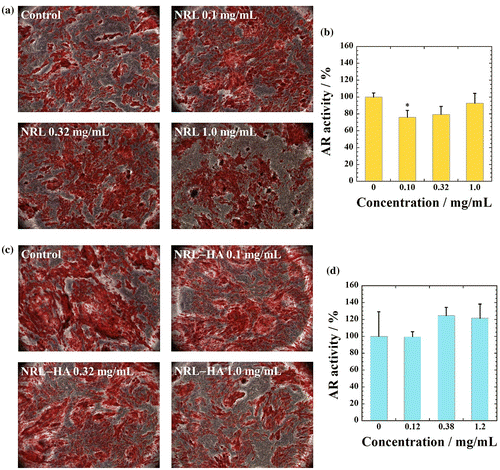
Note: * indicates p < 0.05 compared with control
Figure 7 (a) Alizaline staining and (b) qualitative evaluation of calcium deposition by MC3T3-E1 cells cultured with different NRL nanoparticle concentrations (0.10, 0.32, and 1.0 mg/mL) after 20 days. (c) Alizaline staining and (d) qualitative evaluation of calcium deposition by MC3T3-E1 cells cultured with different NRL-HA nanoparticle concentrations (0.10, 0.38, and 1.2 mg/mL) after 20 days. Data were expressed as mean ± S.D. (n = 4)
Supplemental material

YNAN_1352111_Supplementary_Material.docx

Download MS Word (323.2 KB)