
Figures & data
Scheme 1. Synthesized procedure of KCC-1-NH2-Cys.
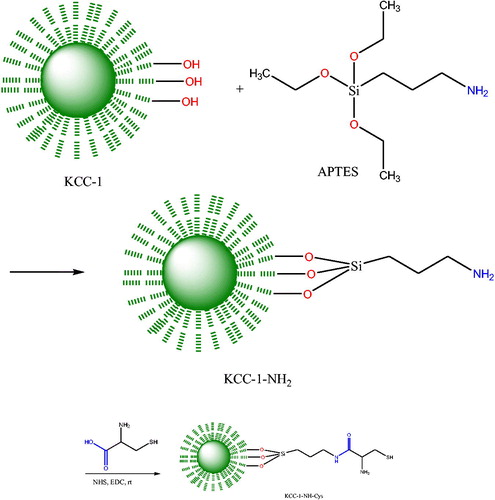
Figure 1. TEM images of KCC-1, KCC-1-NH2, and KCC-1-NH2-Cys.
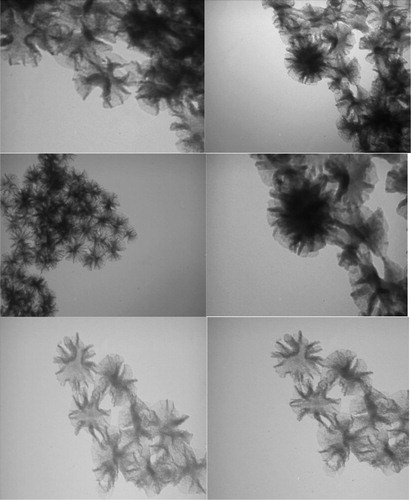
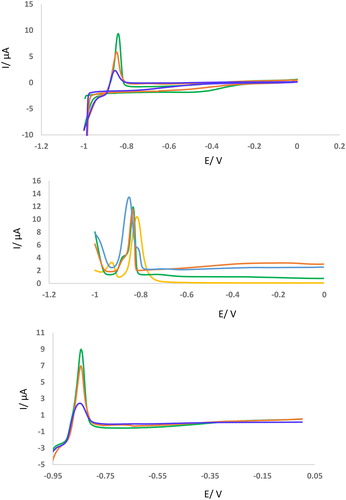
Figure 2. (A-C) CVs, DPVs, and LSVs of GCE in the presence of Cd2+ (2.5 mM) before and after incubation with KCC-1-NH2-Cys (0.02 g). Sweep rate of CV is 50 mV/s. Sweep rate of CV is 100 mV/s. Sweep rate of LSV is 100 mV/s. Modulation time = 0.05, Interval time = 0.25, Modulation amplitude= 0.025.
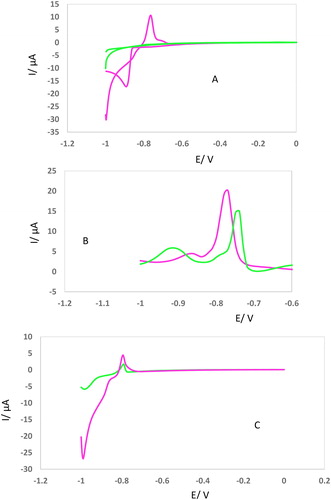
Figure 3. (AC) CVs, DPVs, and LSVs of GCE in the presence of Cd2+ (2.5 mM) after incubation with KCC-1-NH2-Cys (0.02 g) in different incubation time (15, 30, 45, 60 min). All of conditions and parameters are similar to .
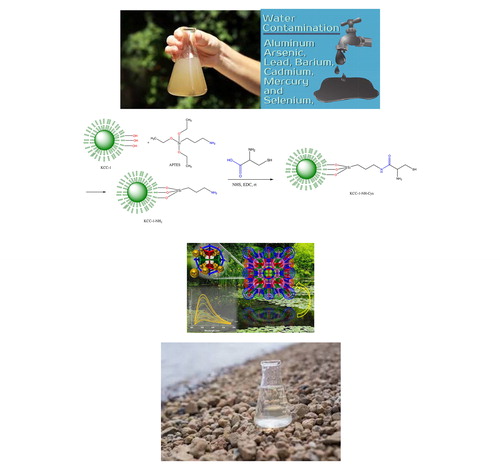
Scheme 2. Schematic representation of cations removal from aqueous solution using KCC-1-NH2-Cys.
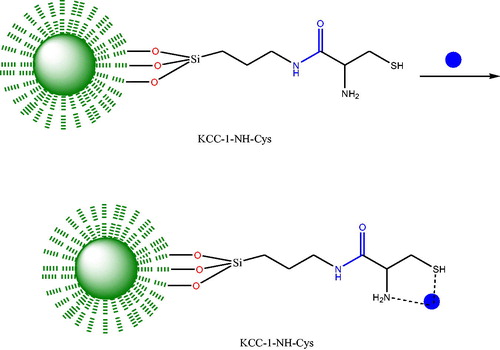
Figure 4. DPVs of GCE in the presence of different concentration of Cd2+ (2.5, 5, 7.5, 10, 20 mM) after incubation with KCC-1-NH2-Cys (0.02 g). Modulation time = 0.05, Interval time = 0.25, Modulation amplitude= 0.025.
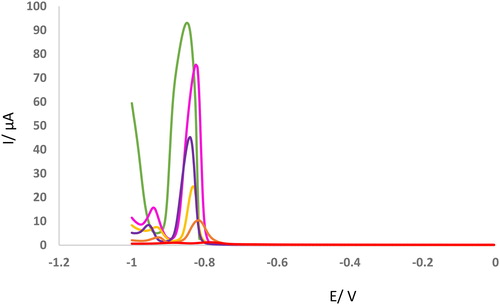
Table 1. Amount of ions in river-water and local natural ground water samples analyzed by proposed method.