3,489
Views
9
CrossRef citations to date
0
Altmetric
Rapid Communications

Facile synthesis of graphene oxide/Fe3O4 nanocomposite for electrochemical sensing on determination of dopamine

ORCID Icon, , , , , & show all
Pages 155-166 | Received 18 Apr 2022, Accepted 08 Jun 2022, Published online: 22 Jun 2022

Figures & data

Figure 1. Measurement steps for dopamine analysis using GO/Fe3O4/GCE.

Figure 1. Measurement steps for dopamine analysis using GO/Fe3O4/GCE.

Figure 2. UV-Vis spectra of GO and GO/Fe3O4.

Figure 2. UV-Vis spectra of GO and GO/Fe3O4.

Figure 3. SEM images of (A) GO and (B) GO/Fe3O4 composites with 40,000x magnification, and TEM images of (C) GO and (D) GO/Fe3O4.

Figure 3. SEM images of (A) GO and (B) GO/Fe3O4 composites with 40,000x magnification, and TEM images of (C) GO and (D) GO/Fe3O4.

Figure 4. EDX Spectrum of GO/Fe3O4 nanocomposites.

Figure 4. EDX Spectrum of GO/Fe3O4 nanocomposites.

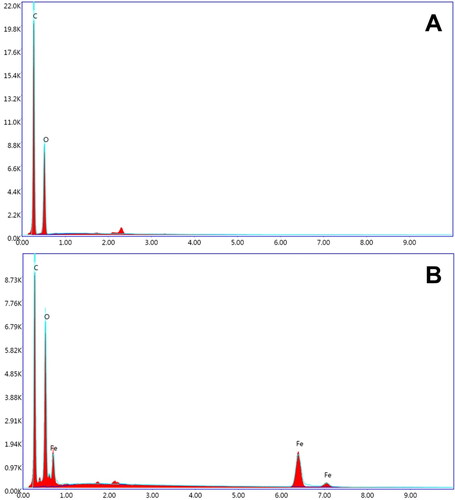
Table 1. Chemical composition GO/Fe3O4 nanocomposites.

Figure 5. XRD spectrum of GO and GO/Fe3O4 nanocomposites.

Figure 5. XRD spectrum of GO and GO/Fe3O4 nanocomposites.

Figure 6. Raman spectrum of GO and GO/Fe3O4 nanocomposites.

Figure 6. Raman spectrum of GO and GO/Fe3O4 nanocomposites.

Figure 7. Electrochemical performance using CV of 10 mM [Fe(CN)6]3−/4− in 10 mM PBS (pH 7.4).

Figure 7. Electrochemical performance using CV of 10 mM [Fe(CN)6]3−/4− in 10 mM PBS (pH 7.4).

Figure 8. (a) CV responses of different electrodes in 10 μM dopamine, (b) Scan rate variation measurements of GO/Fe3O4 electrode on 10 μM dopamine, (c) DPV measurements of dopamine concentration variation of 0–20 μM, and (d) Calibration curve of DPV measurements of dopamine from 0–10 μM (n = 3).

Figure 8. (a) CV responses of different electrodes in 10 μM dopamine, (b) Scan rate variation measurements of GO/Fe3O4 electrode on 10 μM dopamine, (c) DPV measurements of dopamine concentration variation of 0–20 μM, and (d) Calibration curve of DPV measurements of dopamine from 0–10 μM (n = 3).

Figure 9. Illustration of electrode interface reactions.

Figure 9. Illustration of electrode interface reactions.

Figure 10. Selectivity test on 4.5 mM glucose, 5 mM urea, 5 mM ascorbic acid, and 10 μM dopamine solutions.

Figure 10. Selectivity test on 4.5 mM glucose, 5 mM urea, 5 mM ascorbic acid, and 10 μM dopamine solutions.

Figure 11. Peak current (Ip) change on day-to-day measurements (stability test).

Figure 11. Peak current (Ip) change on day-to-day measurements (stability test).

Table 2. Comparison with other publications on dopamine detection.
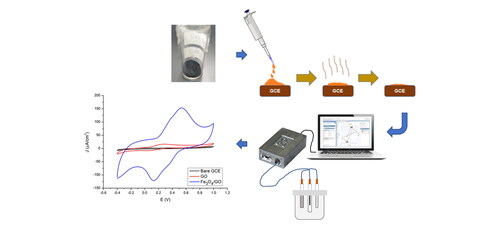
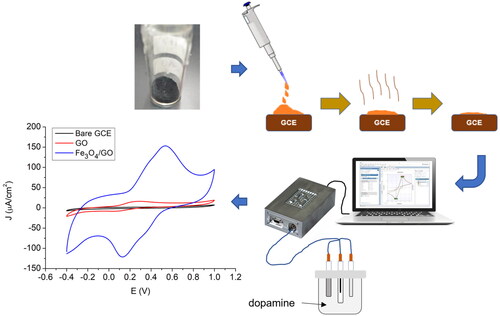