Figures & data
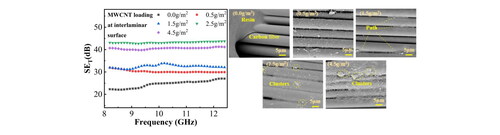
Figure 1. Preparation process of multiscale hybrid MWCNT/CF/PEEK laminates.
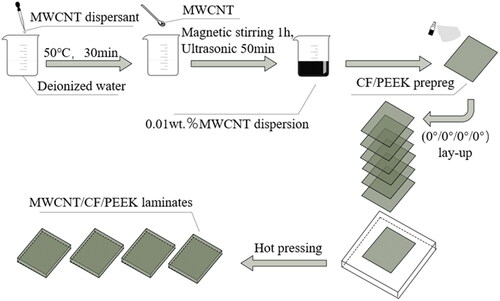
Figure 2. Temperature and pressure profile for compression moulding of MWCNT/CF/PEEK composite samples.
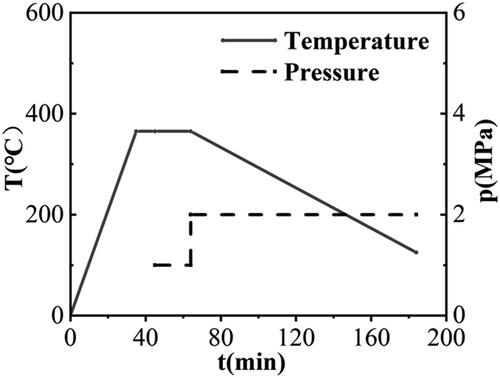
Figure 3. (a, a′) TEM images of MWCNTs used in this study; SEM images of MWCNTs distribution on the prepreg surface: (b, b′) 0.0 g/m2; (c, c′) 0.5 g/m2; (d, d′) 1.5 g/m2; (e, e′) 2.5 g/m2; (f, f′) 4.5 g/m2.
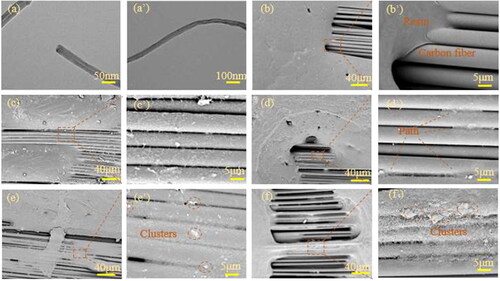
Figure 4. Mechanical properties of MWCNT/CF/PEEK laminates: (a) tensile strength; (b) elastic modulus; (c) flexural strength; (d) flexural modulus. Note: the solid triangle indicates the improvement in relevant property compared to that of untreated CF/PEEK composites.
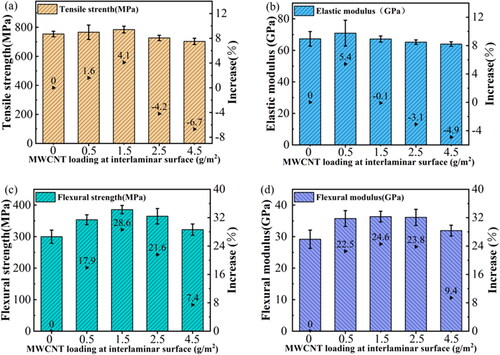
Figure 5. SEM images of tensile fracture surface of the laminates: (a) 0.0 g/m2; (b) 0.5 g/m2; (c) 1.5 g/m2; (d) 2.5 g/m2; (e) 4.5 g/m2.
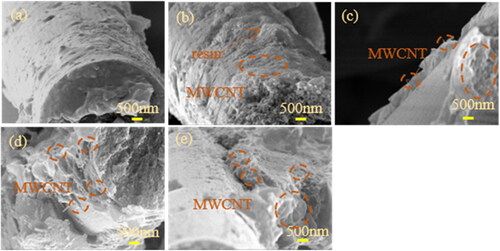
Figure 6. Electrical conductivity of MWCNT/CF/PEEK composites as a function of MWCNT content. Note: the solid triangle indicates the improvement in the conductivity compared to that of untreated CF/PEEK composites.
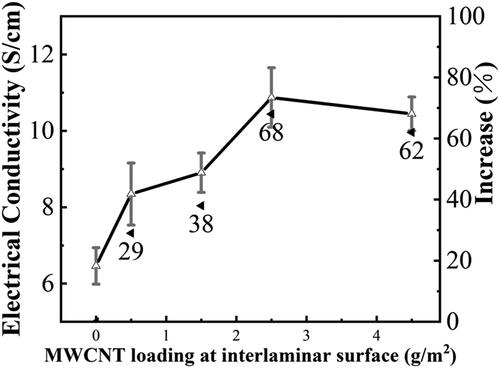
Table 1. Electrical conductivity of MWCNT/CF/PEEK composites as a function of MWCNT loading expressed in terms of g/m2 and wt.% at the interface.
Figure 7. (a) Total shielding effectiveness SET of MWCNT/CF/PEEK composites in the whole X-band; (b) Average SEA, SER and SET values of MWCNT/CF/PEEK laminates.
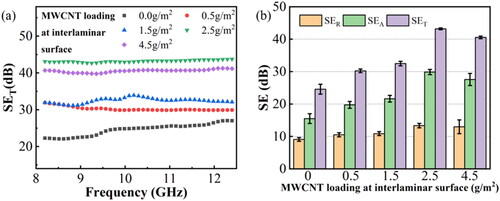
Table 2. EMI SE comparison of nanofiller reinforced polymer composites in X band.
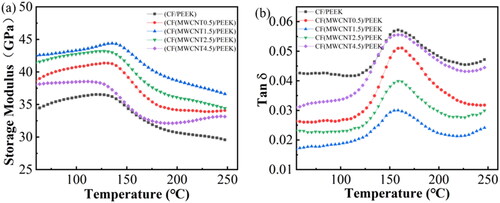
Figure 8. DMA results of MWCNT/CF/PEEK laminates with different MWCNT loading: (a) storage modulus G′ and (b) Tan δ.