Figures & data
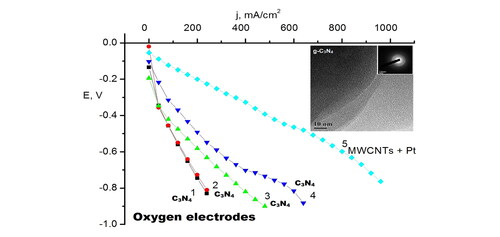
Figure 1. Mock-up of the fuel half-cell. 1 - cell housing: 2 - pressure clutch; 3 – metal current lead and tube for oxygen supply; 4 - metal grid of the oxygen electrode; 5 - hydrophobic layer of oxygen electrode; 6 - the active layer of the oxygen electrode from the g-C3N4 particles; 7 - polytetrafluoroethylene gasket; 8 - reference electrode; 9 - zinc anode.
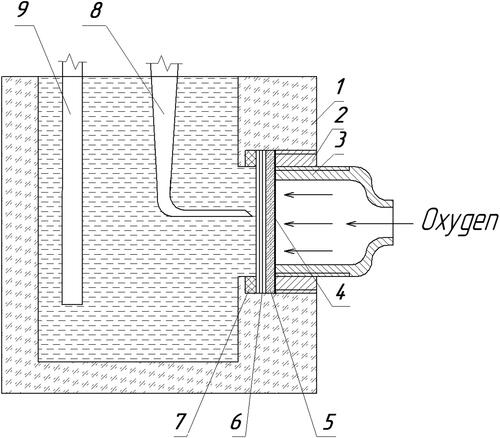
Figure 2. X-ray diffraction patterns of the prepared carbon nitride samples: I (curve 1); III (curve 2); II (curve 3); IV (curve 4).
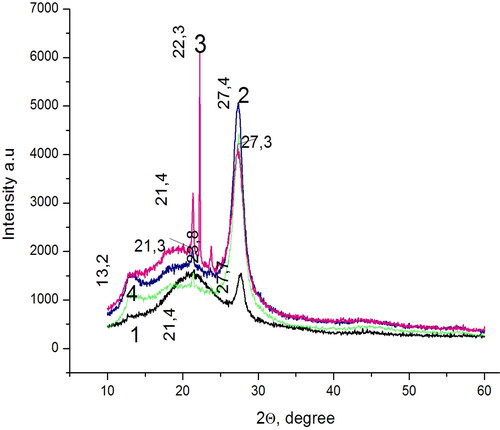
Figure 3. The TEM image of a rather large g-C3N4 particle (of about 1 µm) demonstrating the complicated shape of the prepared particles of II and their high transparency to electron beam. The SAED pattern in the inset shows two very weakly expressed wide (similar to amorphous) diffraction rings, with two pairs of symmetric reflections and a separate reflection. These bright reflections are located in the middle of weak diffraction rings indicating that the large crystalline particles are of the same g-C3N4 origin as the small ones.
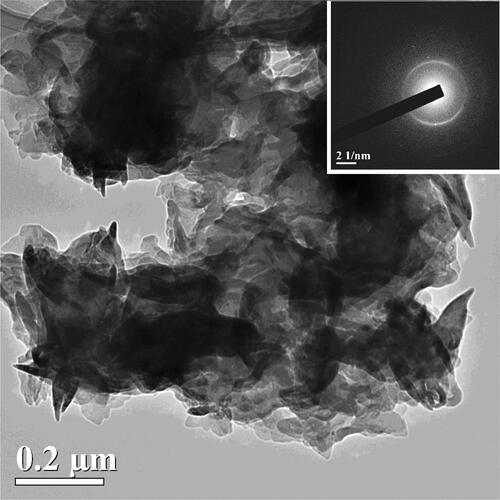
Figure 4. IR spectra of the prepared C3N4 samples I-IV in the regions of: (a) 3800–2600 and (b) 1800–700 cm−1. For comparison, IR spectrum of bare KBr disk is shown (blue curve).
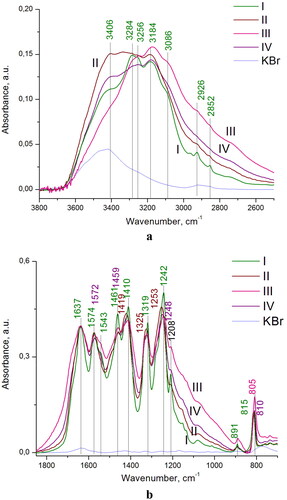
Figure 5. Optical absorption spectra of g-C3N4 samples: I – curve 1; II –curve 2; IV –curve 3; III – curve 4. As the nitrogen content in the obtained materials decreases in order of I < II < III = IV, the band gap increases in the same order due to a decreased number of the defects states. The upper location of melamine precursor over the urea powder during the synthesis of III results in the production of nitrogen-doped С3N4, showing the largest band gap of 2.4 eV for the 1:1 components weight ratio.
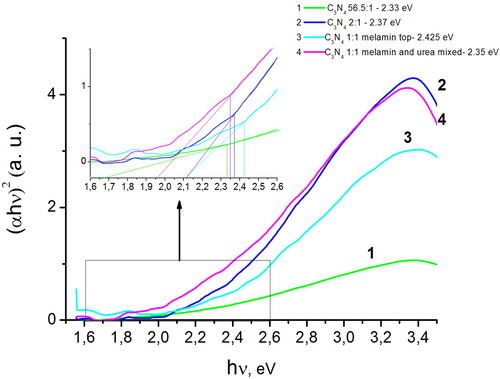
Figure 6. Cyclic voltammograms with oxygen flow for the g-C3N4 samples: III –curve 1; IV – curve 2; II – curve 3; I –curve 4.
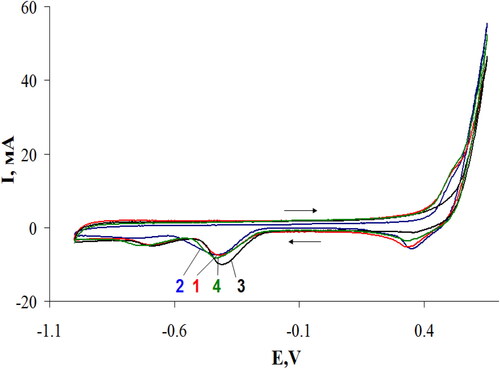
Figure 7. Current-voltage characteristics of the oxygen electrodes with an active layer made of different electrode materials: C3N4 (IV) - curve 1; C3N4 (III) – curve 2; C3N4 (I) – curve 3; C3N4 (II) – curve 4; and MWCNTs with 10 wt.% Pt - curve 5.
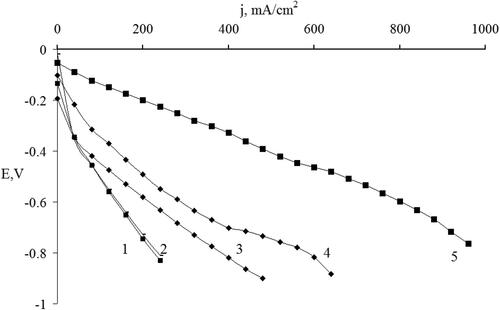
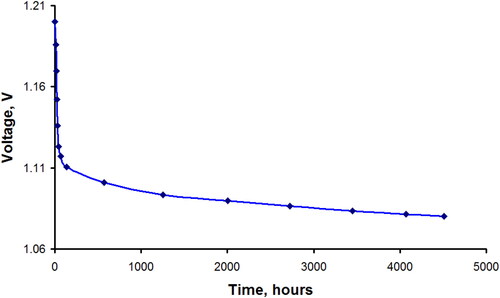
Figure 8. Results of the long-term testing of a two-layer oxygen electrode with an active layer consisting of 0.014 g cm−2 of C3N4 (II) coupled with a zinc anode under constant operating current density at the oxygen electrode of 200 mA cm−2.