Figures & data
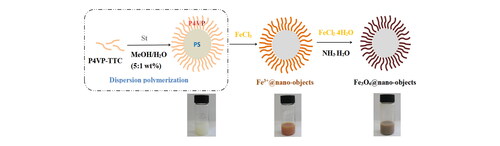
Scheme 1. Schematic illustration for the preparation of Fe3O4@nanoparticles.
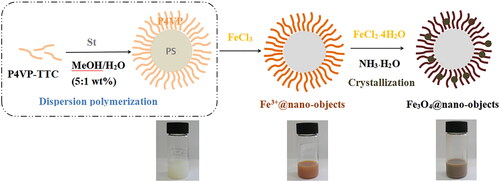
Table 1. Characteristics of the P4VP-TTC and P4VP-b-PS block copolymer.
Scheme 2. Schematic illustration of the synthesis of Fe3+@P4VP-b-PS nanoparticles.
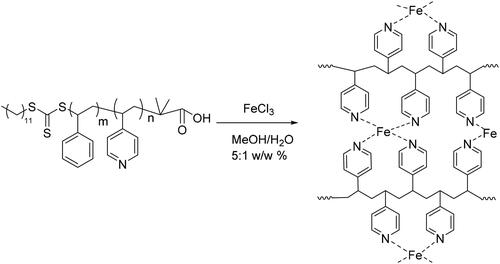
Figure 1. TEM images of samples prepared from (A) P4VP-b-PS nanoparticles;(B) Fe3+@ P4VP-b-PS nanoparticles and (C) Enlargement of the picture in the box (Note: The molar ratio of Fe3+ with respect of pyridyl groups of P4VP is 1:10).
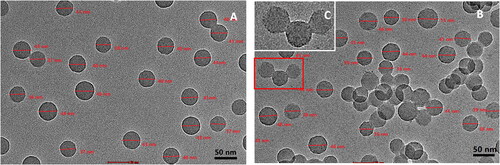
Figure 2. TGA of (A) P4VP-b-PS nanoparticles and (B) Fe3+@P4VP-b-PS nanoparticles (Note: The molar ratio of Fe3+ with respect of pyridyl groups of P4VP is 1:10).
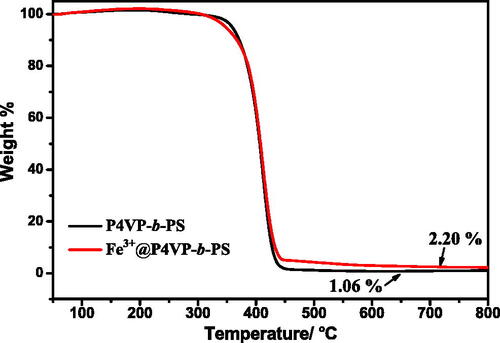
Figure 3. XPS spectra of (A) recorded for P4VP-b-PS nanoparticle and Fe3O4@P4VP-b-PS nanoparticle; (B) Fe2p signals for Fe3O4@P4VP-b-PS and (C) XRD patterns of neat PS-b-P4VP and Fe3O4@P4VP-b-PS nanoparticle. (Note: The molar ratio of Fe3+ with respect of pyridyl groups of P4VP is 1:10; The molar ratio of Fe3+:Fe2+is 1:1).
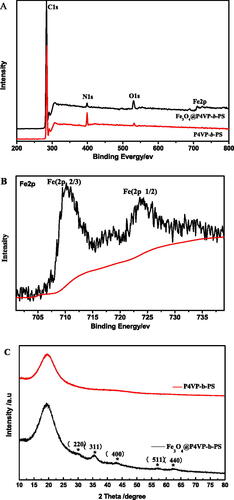
Figure 4. FT-IR spectra for P4VP-b-PS and Fe3O4@P4VP-b-PS nanoparticles.
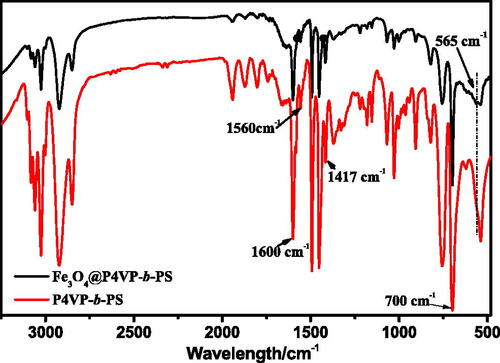
Figure 5. TEM images of P4VP-b-PS nanoparticles (A) and Fe3O4@P4VP-b-PS nanoparticles prepared through dispersion polymerization. The molar ratio of FeCl3:P4VP is 1:10 in (B), 1:5 in (C), 1:2 in (D). (E) the enlarged TEM picture of (D). (Note: the molar ratio of Fe3+:Fe2+is 1:1 in all samples.).
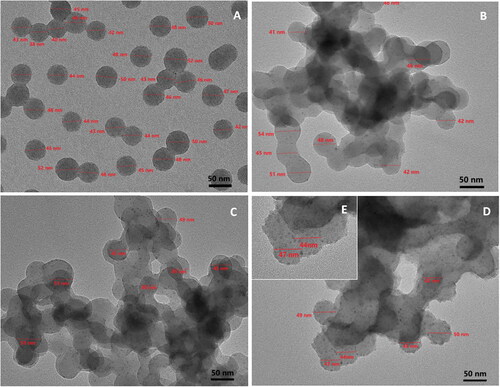
Figure 6. STEM-HAADF images of (A) Fe3O4@P4VP-b-PS Nanoparticles prepared through dispersion polymerization. The molar ratio of FeCl3:P4VP is 1:2. (Note: the molar ratio of Fe3+:Fe2+ is 1:1); (B)-(D) EDX elemental mapping images of (B) C map, (C) Fe map and (D) N map.
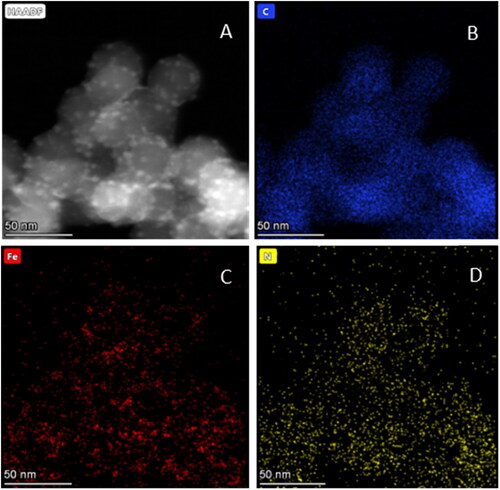
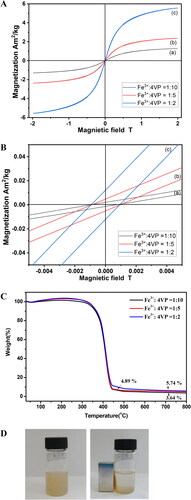
Figure 7. Magnetic hysteresis curves (A) of Fe3O4@P4VP-b-PS nanoparticles prepared through dispersion polymerization. The molar ratio of FeCl3:P4VP is 1:10 in (a), 1:5 in (b), 1:2 in (c). (Note: the molar ratio of Fe3+:Fe2+ is 1:1 in all samples.) (B) A magnified view of the magnetization curves at low applied fields. (C) TGA of Fe3O4@P4VP-b-PS nanoparticles with molar ratio of FeCl3:P4VP 1:10 in (a), 1:5 in (b), 1:2 in (c). (D) Photograph of the ferrofluid placed next to a magnet.