Figures & data
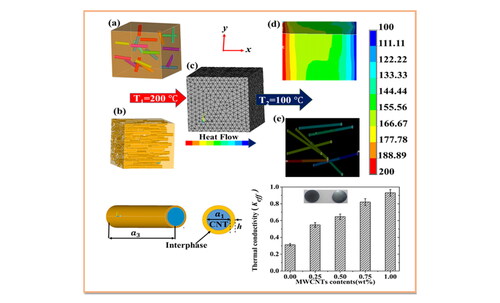
Figure 1. Disc-shape sample extracted from a composite sheet.
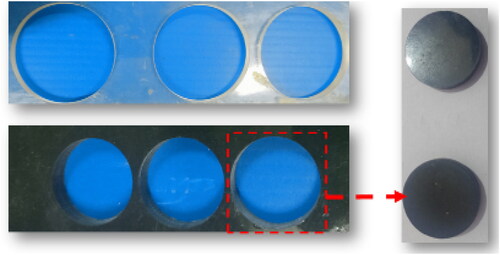
Figure 2. Single CNT with interphase layer thickness.
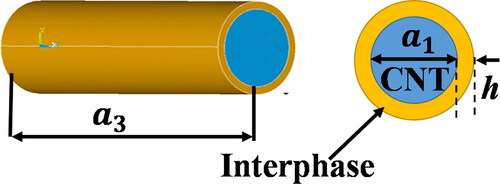
Figure 3. FE simulation 3D views of (a) randomly oriented MWCNTs RVE, (b) aligned MWCNTs along the longitudinal direction RVE, (c) meshed view and heat flow condition in the RVE, (d) temperature gradient created in the RVE, and (e) temperature gradient created in the exposed MWCNTs.
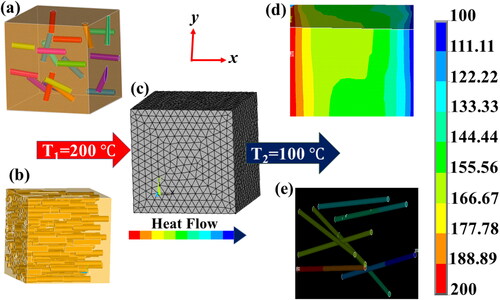
Figure 4. FE-SEM images of fracture surface of the MWCNTs nanocomposites with respect to the MWCNTs concentration a) 0.25 wt% (b) 0.50 wt% (c) 0.75 wt. % and (d) 1 wt%.
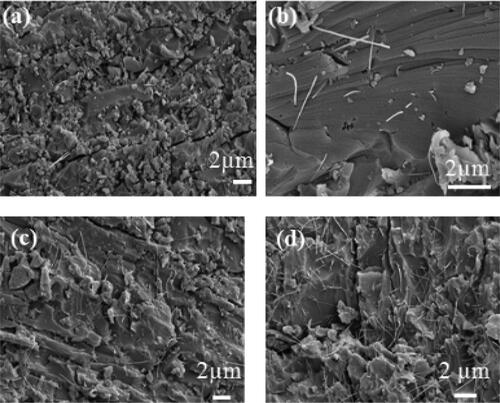
Figure 5. Thermal conductivity of nanocomposites with respect to the MWCNTs concentration 0.25 wt%, 0.50 wt%, 0.75 wt.%, and 1 wt% and inset is the disc-shaped samples of 0.25 wt.% and 1 wt.%.
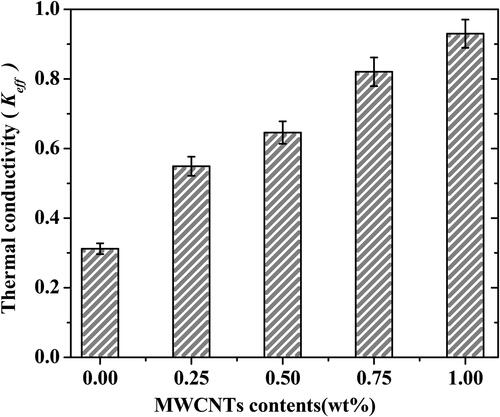
Figure 6. Analysis of thermal conductivity variation in nanocomposites with respect to MWCNT loading, using FE-simulation, MMT, and experimental investigation.
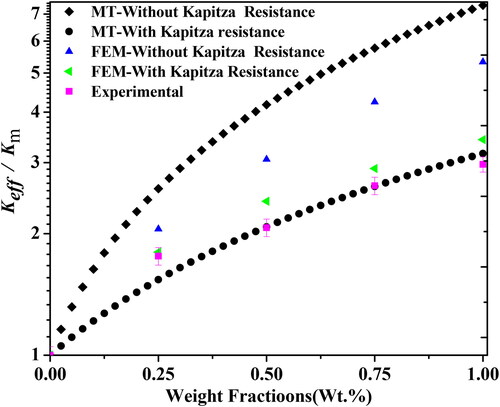
Figure 7. Analysis of thermal conductivity variation in nanocomposites with respect to CNT volume fraction using present MMT, experiment [Citation18] and EM model [Citation45].
![Figure 7. Analysis of thermal conductivity variation in nanocomposites with respect to CNT volume fraction using present MMT, experiment [Citation18] and EM model [Citation45].](/cms/asset/8b7c506d-3963-4f0d-908b-1a0678301cd3/ynan_a_2218240_f0007_c.jpg)
Figure 8. Thermal conductivity of nanocomposites with randomly oriented and axial alinged MWCNTs upto 1 wt% concentration.
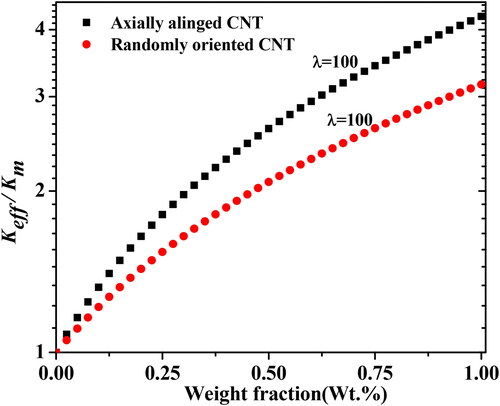
Figure 9. Thermal conductivity of nanocomposites with varying aspect ratio() of randomly oriented MWCNTs loading up to 1 wt.%.
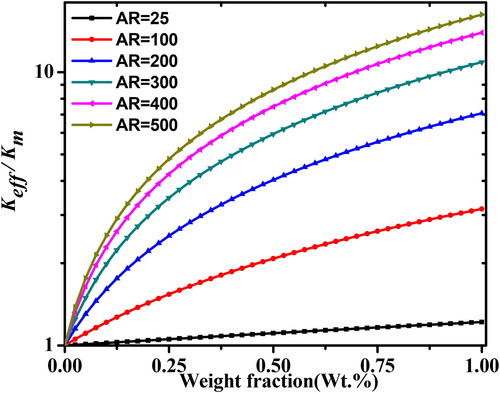
Figure 10. Normalized effective thermal conductivity with interphase thickness for different weight fraction.
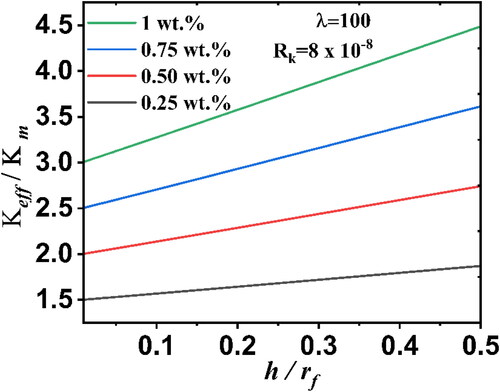
Figure 11. Normalized effective thermal conductivity vs. varying interfacial thermal resistance (ITR) for different interphase thickness for (a) 0.25 wt.%, (b) 0.50 wt.%, (c) 0.75 wt.%, and (d) 1 wt.% of MWCNTs.
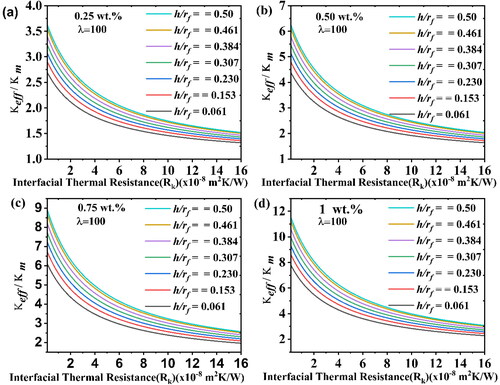
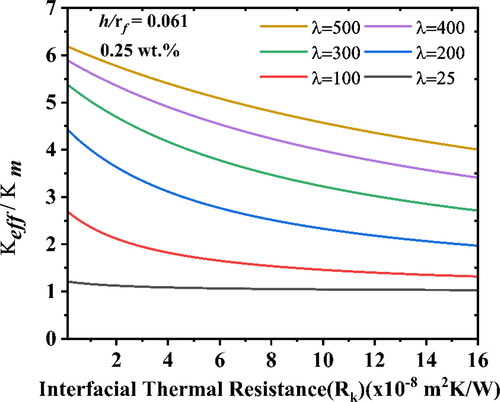
Figure 12. Normalized effective thermal conductivity vs. varying interfacial thermal resistance (ITR) for different aspect ratios.