
Figures & data
Scheme 1. The preparation strategy for Hcy-modified AuNCs using the microwave-assisted method.
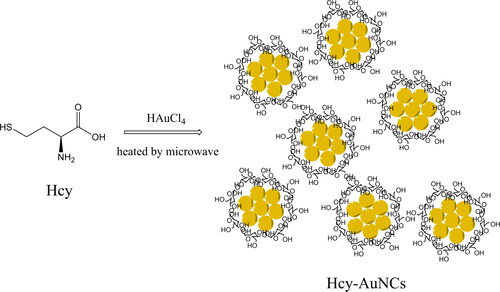
Figure 1. Emission spectra of Hcy-AuNCs prepared upon various microwave powers and irradiation times. The reference sample was a mixture of HAuCl4 and Hcy upon no microwave heating.
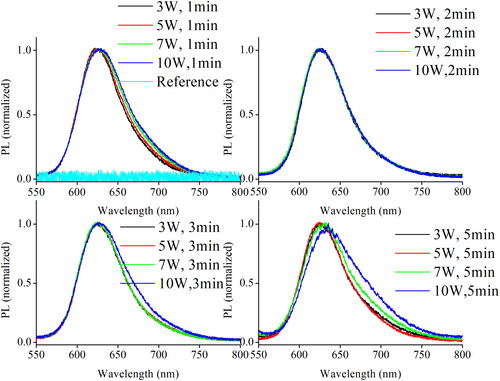
Table 1. Summarized photophysical parameters of AuNCs synthesized under various microwave powders and irradiation time.
Figure 2. XPS spectrum (a) and TEM image (b) of the as-synthesized AuNCs sample (5 W/2 min).
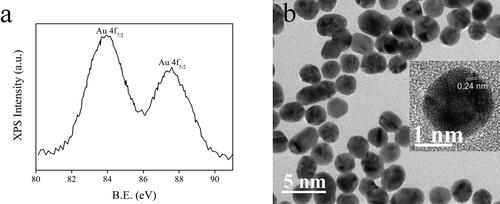
Figure 3. DLS (a) and Zeta potential (b) of the as-synthesized AuNCs sample (5 W/2 min).
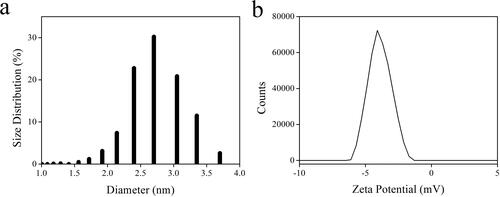
Figure 4. IR spectra of Hcy and the as-synthesized AuNCs sample (5 W/2 min).
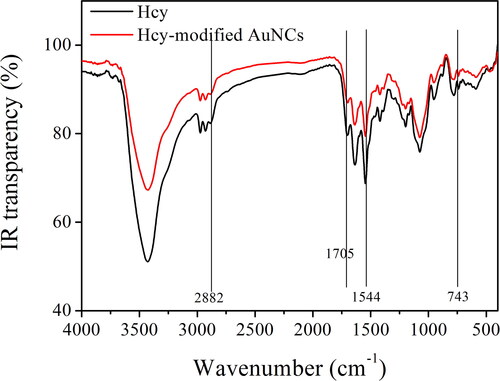
Figure 5. Absorption, excitation, and emission spectra of the as-synthesized AuNCs sample (5 W/2 min).
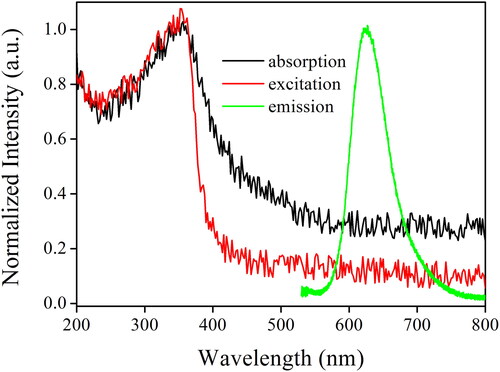
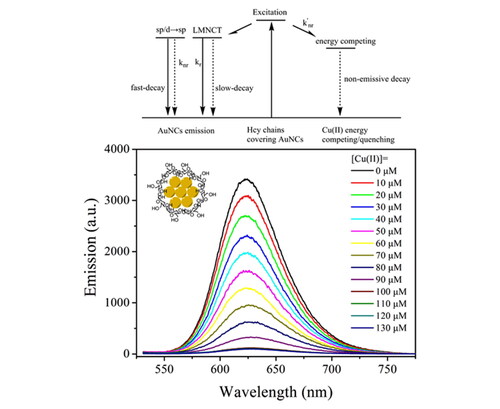
Figure 6. Emission decay dynamics curves (a) of the as-synthesized AuNCs sample (5 W/2 min) without and with Cu(II) (100 μM). Emission spectra (b) of the as-synthesized AuNCs sample (5 W/2 min) upon increasing Cu(II) concentrations from 0 to 130 μM.
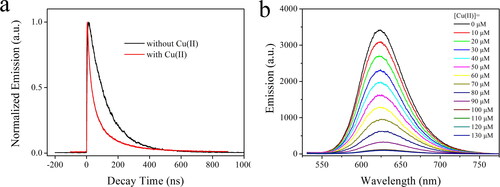
Table 2. Biexponential emissive decay parameters of the AuNCs (5 W/2 min).
Scheme 2. A possible sensing/energy competing mechanism of Hcy-AuNCs towards Cu(II).
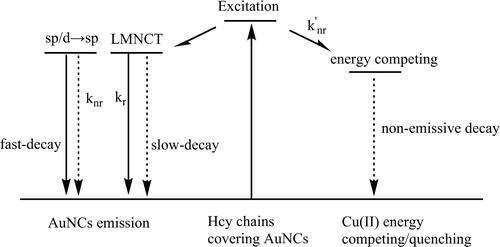
Figure 7. Stern–Volmer equation (a) of the as-synthesized AuNCs sample (5 W/2 min) upon increasing Cu(II) concentrations from 0 to 130 μM fitted with Formula 4. Emission intensity monitoring of the as-synthesized AuNCs sample (5 W/2 min) when Cu(II) and EDTA are periodically added.
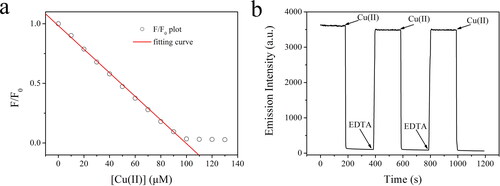
Figure 8. F/F0 ratios of the as-synthesized AuNCs sample (5 W/2 min) upon competing ions (100 μM). 1 = blank, 2 = Cu2+, 3 = AcO–, 4 = PO4–, 5 = SO4–, 6 = NO3–, 7 = Cl–, 8 = Br–, 9 = I–, 10 = Na+, 11 = Mg2+, 12 = Ca2+, 13 = Zn2+, 14 = Cd2+, 15 = Co2+, 16 = Al3+, 17 = Fe3+, 18 = Fe2+, and 19 = Hg2+.
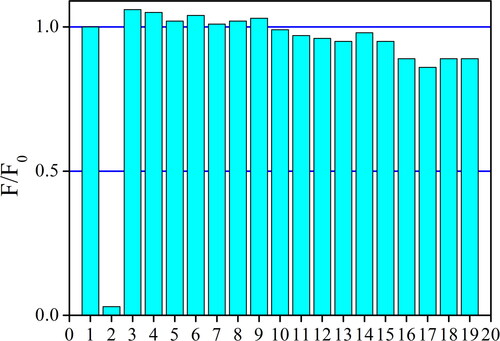
Table 3. Sensing performance comparison between Hcy-modified AuNCs and literature sensing systems.
Table 4. Sensing repeatability of Hcy-modified AuNCs.
Data availability statement
Data are available upon reasonable request from the corresponding authors.