
Figures & data
Scheme 1. Illustration of the fabrication route of the ternary P(OT)/GO/CS, P(OT)/GO/SE, and P(OT)/GO/ST NCs.
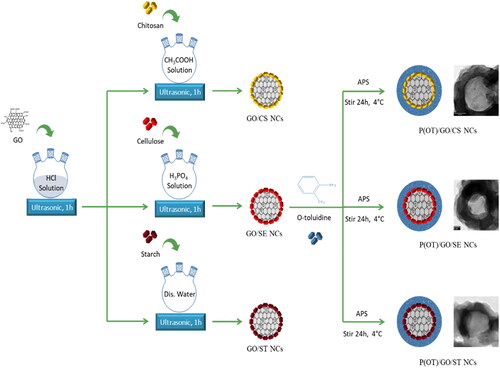
Figure 1. XRD patterns (A), IR spectrum (B), Raman spectrum (C) and Isotherm curve (D) of P(OT) and its NCs.
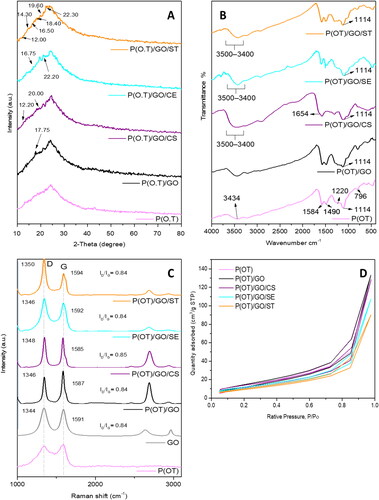
Table 1. The SBET, total pore volumes, and average diameters of P(OT) pure, P(OT)/GO, P(OT)/GO/CS, (OT)/GO/SE, and P(OT)/GO/ST NCs.
Figure 2. SEM images of P(OT) (A), P(OT)/GO NCs (B), P(OT)/GO/CS NCs (C), P(OT)/GO/SE NCs (D) and P(OT)/GO/ST NCs (E), and TEM images of P(OT) (F), P(OT)/GO NCs (G), P(OT)/GO/CS NCs (H), P(OT)/GO/SE NCs (I), and P(OT)/GO/ST NCs (J).
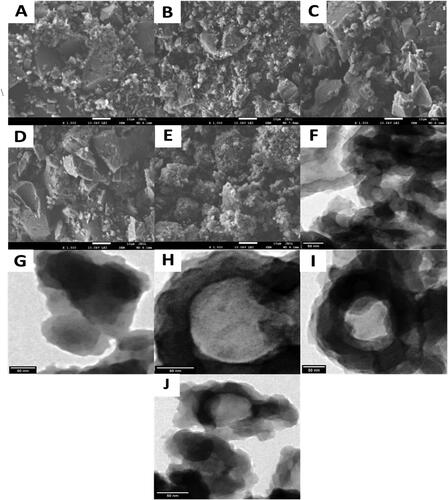
Figure 3. (A) TGA curves and (B) DTG curves for pure P(OT) and its NCs.
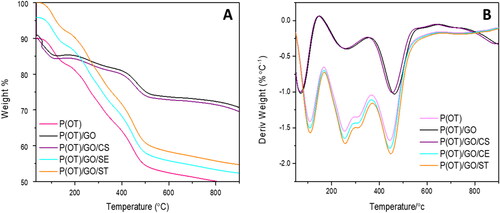
Table 2. Thermal behaviour of P(OT), binary P(OT)/GO NCs, ternary P(OT)/GO/CS NCs, ternary P(OT)/GO/SE NCs and ternary P(OT)/GO/ST NCs.
Scheme 2. Illustration of the fabrication procedure of ternary P(OT)/GO/CS NCs (a) and proposed mechanism of dye removal (b).
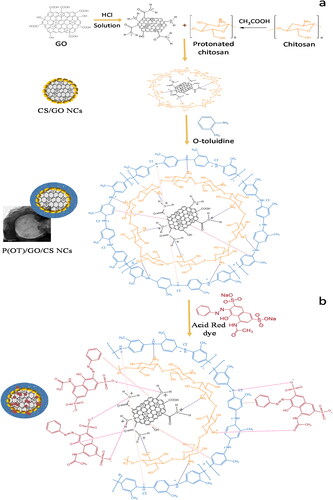
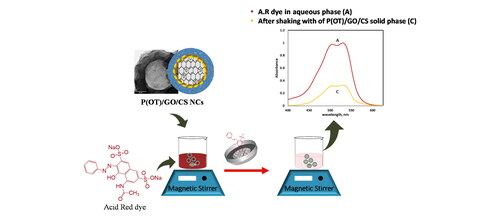
Figure 4. (A) Comparison of the efficiency of the five samples in removing the A.R. dye from an aqueous phase. (B) The electronic spectra of 20 ppm concentration of A.R. dye in aqueous phase (a), and after shaking with 5 mg of P(OT) solid phase (b), and after shaking with 5 mg of P(OT)/GO/CS solid phase (c).
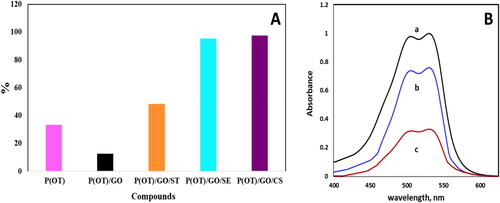
Table 3. Adsorption capacity of various adsorbents on Acid Red dye.
Figure 5. Optimization of parameters for the adsorbent solid phases of A.R. dye from the solution samples. Effect of the solution pH with contact time 120 min (a), mass of material with shaking time 90 min (B), contact time (C), temperature at 10, 20, 35, and 50 °C (D) and Influence of concentration of KNO3 (E). (experimental conditions: A.R. dye (20 ppm), pH = 2, 20 ± 0.1 °C temperature, 5 mg of P(OT) (a) and P(OT)/GO/CS NCs (b) solid phases.
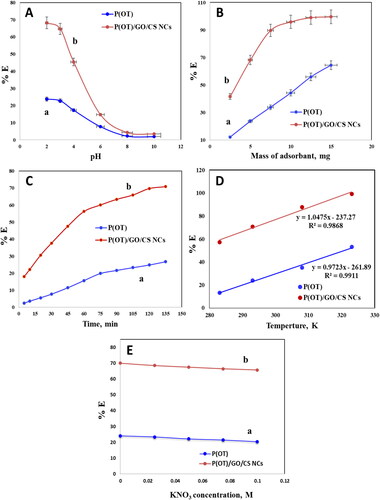
Figure 6. Kinetic models for the adsorption removal of A.R. by P(OT) and P(OT)/GO/CS NCs (A) Weber–Morris plot, (B) Fractional power model, (C) Lagergren plot, (D) Pseudo-second order plot, (E) Elovich model plot and (F) The plot of ln Kc vs. 1000/T for calculating thermodynamic parameters.
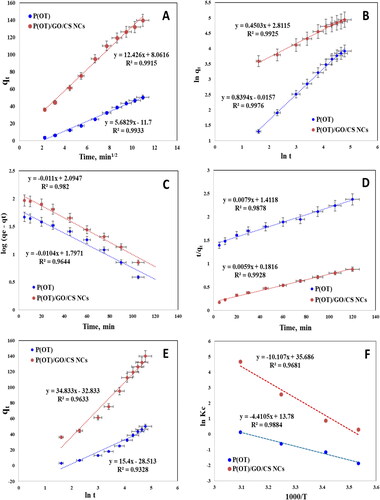
Table 4. Different kinetic models parameters for the adsorption of A.R. dye on the solid phases at 293 K.
Table 5. Illustration thermodynamic parameters at 293 K.
Figure 7. The removal percentages of A.R. dye from different real samples by solid phases P(OT) and P(OT)/GO/CS NCs, (experimental conditions: 50 ml solution, pH = 2, shaking time = 120 min, temp. = 308 K, A.R. concentration 20 mg L−1, and 15 mg of P(OT)/GO/CS NCs solid phase and 30 mg P(OT) solid phase).
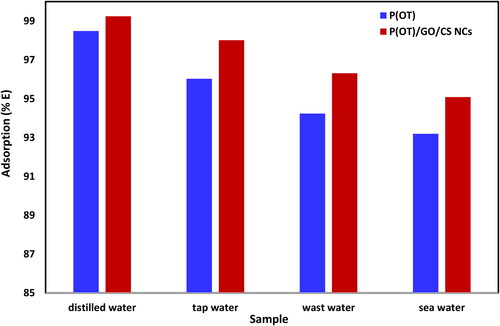
Table 6. The percentages of A.R. dye removed from the real samples by P(OT) and P(OT)/GO/CS NCs solid phase.
Data Availability
The authors confirm that the data supporting the findings of this study are available within the article.