Figures & data
Figure 1. Transmission electron microscopy image from the cross-section of a nanocomposite of CNF matrix with a volume fraction of 10% MTM platelets (Image by Dr. Ogawa, CERMAV, Grenoble).
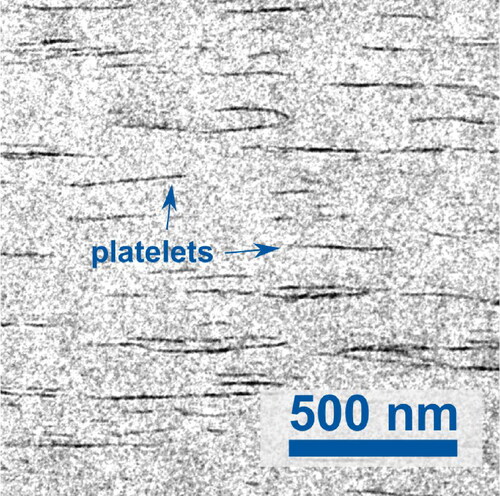
Figure 2. Illustration of the geometry of the composite with its dimensions.
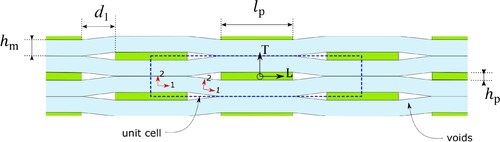
Figure 3. Geometry and boundary conditions for the modeling: (a) boundary source and destination for in-plane modulus study and (b) ¼ of the unit cell to estimate the composite strength based on cellulose matrix tensile fracture assumption.
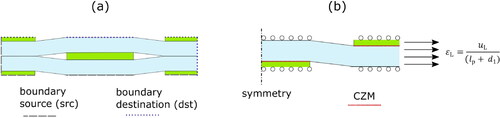
Figure 4. Experimental data: (a) in-plane composite modulus from tensile tests, (b) total nanocomposite porosity, (c) thickness of MTM platelets by Scherrer size from wide angle X-ray diffraction, data from Li et al. [Citation30], Medina et al. [Citation29].
![Figure 4. Experimental data: (a) in-plane composite modulus from tensile tests, (b) total nanocomposite porosity, (c) thickness of MTM platelets by Scherrer size from wide angle X-ray diffraction, data from Li et al. [Citation30], Medina et al. [Citation29].](/cms/asset/a67b202b-d84a-4ef2-96ae-bc7aa566780a/ynan_a_2268307_f0004_c.jpg)
Figure 5. Parametric study from the FE model showing how the composite modulus in the longitudinal direction is affected by the platelet volume fraction, platelet aspect ratio, and porosity. The length of the platelet is = 200 nm, while varying
and
in different configurations. Note the info on fixed quantities in each graph.
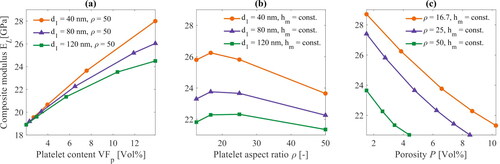
Table 1. Input values for geometrical microstructure parameters (see ) on which the predictions in and are based.
Figure 6. In-plane composite modulus predictions as well as experimental values for two CNF/MTM material systems. The solid lines are the FE simulations, which follow the same trend as the experiments (dashed lines). the rule of mixtures in green overestimates the modulus for high MTM content.
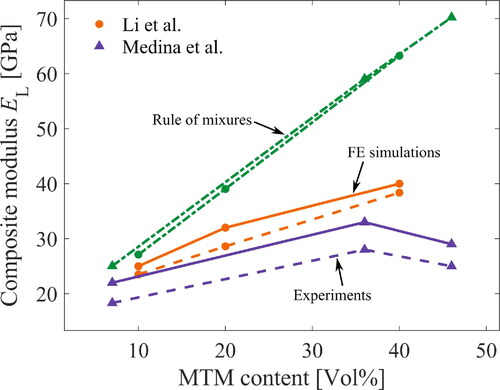
Figure 7. Stress-strain curves (a–b) based on one-fourth of the unit cell and computed from the nanocomposite data in . The fields (c) illustrate the nature of matrix deformation and fracture during increased loading.
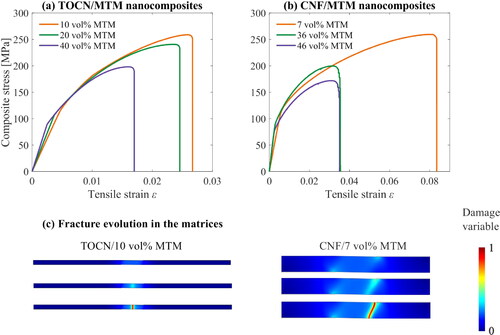
Figure A1. (a) Boundary conditions and material models and (b) FE predictions overlapped on the experimental results.
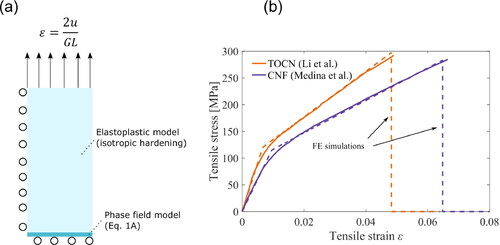
Table A1. Input values for prediction in .
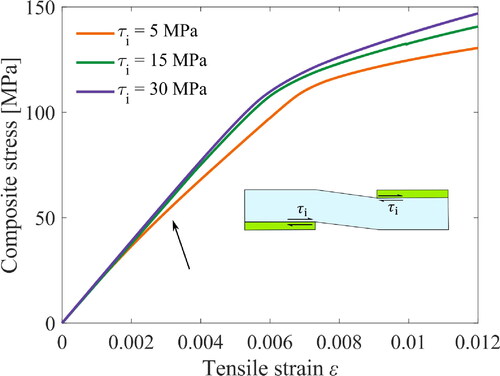
Figure B1. Stress-strain curves from the one-fourth of the unit cell computed from three distinct values of interfacial shear strength.