Figures & data
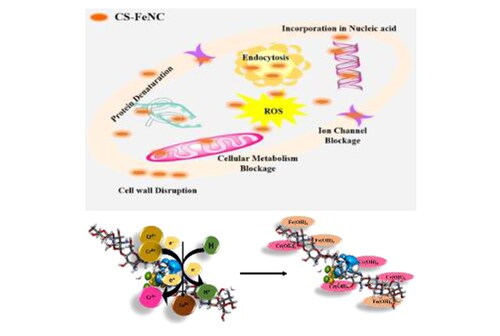
Figure 1. Represents the physicochemical characteristics of CSNP & CS-FeNC (a, b) shows the absorption spectra of CSNPs and CS-Fe NC, respectively, insets of a and b shows the changes in the first derivative of the corresponding spectrum in the region where optical transitions are observed along with the molecular structures) (c) shows room temperature FTIR spectra obtained for CSNP (Blue line) and CS-Fe NC (Brown line). (d) BET nitrogen adsorption/desorption isotherm of CS-Fe NC represents the pore size distribution of CSNP and CS-Fe NC.
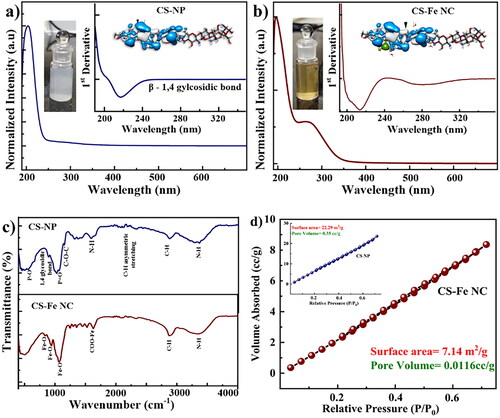
Figure 2. (a) Shows XRD pattern of CS-FeNC the inset shows the XRD of CSNP. The functionalization with Fe3+ on CSNP matrix was confirmed by the appearance of new crystallographic planes/peaks. (b) Represents calculated HOMO-LUMO molecular orbital levels of CSNPs and CS-Fe NC by using DFT simulation studies. (c) Shows the TEM micrographs of polydisperse CS-Fe NC (highlighted in yellow), which are spherical in nature with an average particle size of ≈63 nm. Inset shows the particle size distribution & SAED pattern. (d) SCD simulation represents the ZP distribution and surface charge behaviour of CS-Fe NC.
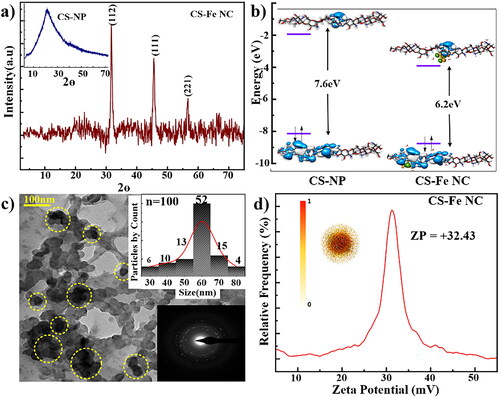
Figure 3. Represents the antibacterial activity of CSNP and CS-FeNC (a, b) shows the antibacterial activity of CSNPs against E. coli and S. aureus, (c, d) shows the antibacterial activity of CS-FeNC against E. coli and S. aureus (e) schematic representation of the mechanism of antibacterial activity.
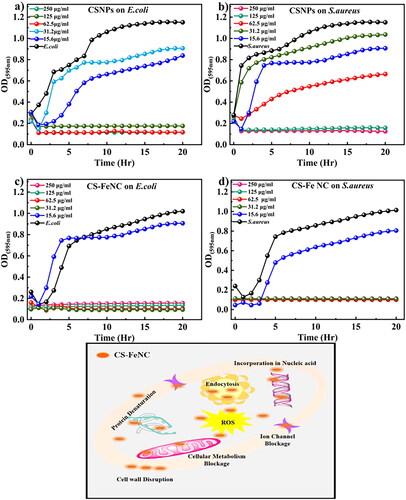
Figure 4. Represents the comparative analysis of the cytotoxic effect on Vero cells when treated with CSNP and CS-Fe NC, respectively.
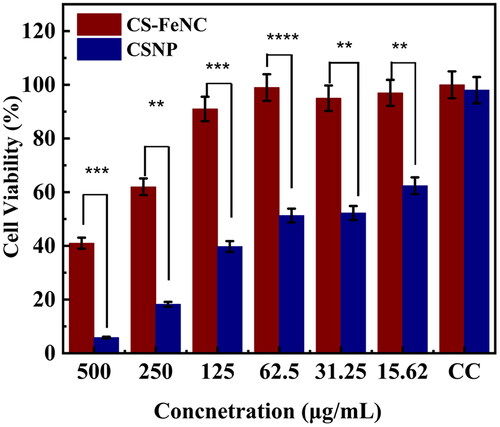
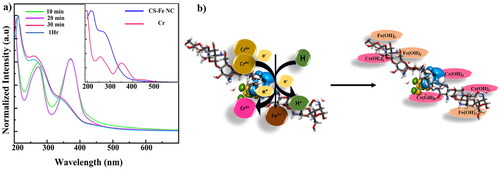
Figure 5. (a) UV–Vis absorption spectrum representing the formation of coordination complex between CS-Fe NC and Cr (VI) the inset shows the spectra of pristine CS-Fe NC & Cr standard (K2Cr2O7) (b) schematic representation of reaction mechanism between CS-Fe NC and Cr (VI).