Figures & data
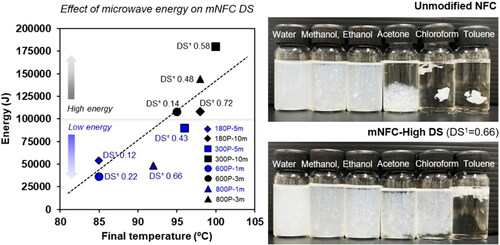
Figure 1. Schematic diagram of NFC esterification using simple microwave-assisted process.
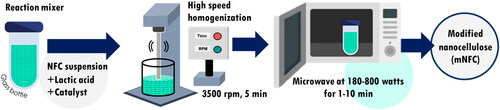
Table 1. Reaction conditions and parameters to modify NFC using simple microwave heating.
Table 2. Effects of the NFC:LA molar ratio and amount of HCl on the degree of substitution (DS) of mNFC.
Figure 2. The Relationship between microwave energy and final reaction’s temperature (a) and weight reduction of mNFC suspension after microwave heating (b); Low weight reduction (less than 10%) denotes the loss of solely water molecules, but medium to high weight reduction (>10%) indicates the loss of water molecules as well as solid mNFC ejected from the reaction bottle due to steam explosion.
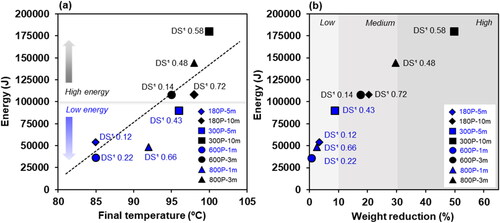
Figure 3. Chemical structure analysis: NFC and mNFC with different DS levels (mNFC-Low DS, mNFC-Med DS, and mNFC-High DS) via; (a) FTIR, (b) 1H liquid-state NMR, and (c-d) XPS spectra.
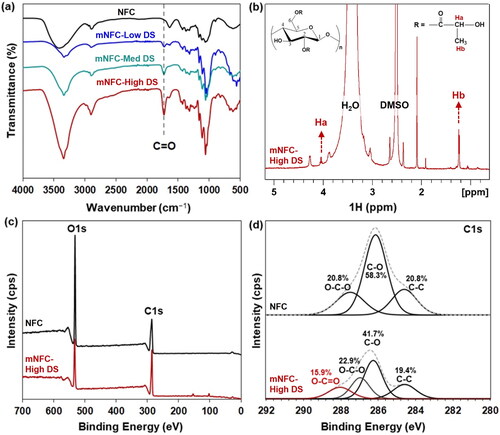
Table 3. Comparing the DS values of mNFC assessed from three different techniques.
Figure 4. (a) X-ray diffraction patterns and crystallinity index (embedded in top right corner) of NFC and mNFC; (b) TEM images of NFC and mNFC-High DS.

Figure 5. Thermograms of NFC and mNFC with Low DS, Med DS, and High DS; (a) DSC, (b) TGA, and (c) DTG.
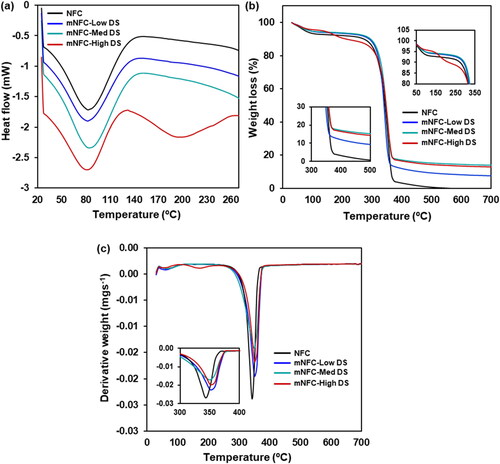
Figure 6. Dispersion of NFC and mNFC with different DS levels in solvents ranging in the order of decreasing polarity.
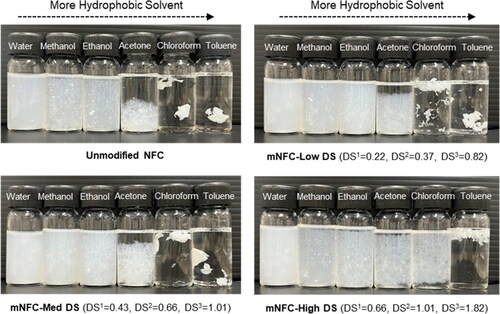
Figure 7. Photographs of PLA solution (pure PLA) and PLA/NFC solution and PLA/mNFC-High DS solution (a) and the subsequent casted films of the aforementioned solutions with thickness of 30–50 µm (b).
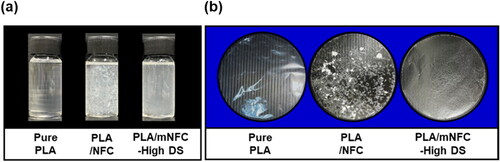
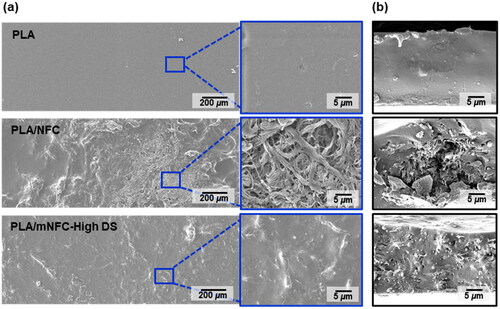
Figure 8. SEM images of (a) film surface and (b) fractured surface morphology of pure PLA film and nanocomposite films of PLA/NFC and PLA/mNFC-High DS.