Figures & data
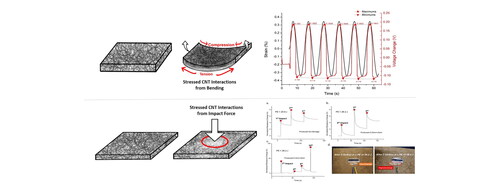
Figure 1. Continuous roll of carbon nanotube buckypaper with high magnification of microscopy image of CNT network structure.
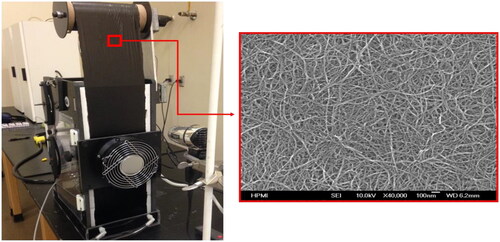
Figure 2. Illustration of structural response to a. flexural strain and b. low-force impact. External stress and strain deform the CNT network, leading to changes in electrical resistance.
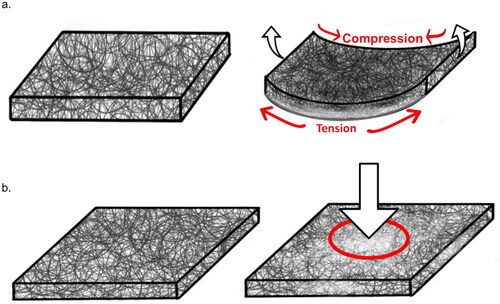
Figure 3. Process flow of scalable sensor manufacturing process that includes printing with a typical inkjet printer and easy lamination.
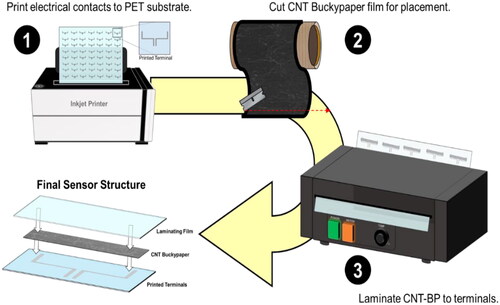
Figure 4. Final low-profile CNT-BP sensor design and size perspective using mailbox key. Sensors are 220 µm thick.
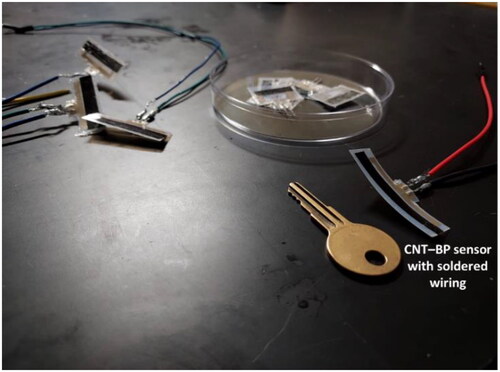
Figure 5. Three-point bending test on carbon fiber reinforced plastic (CFRP) coupons. (a) position of load pin prior to testing or as it disengages with specimen, (b) position of load pin after loading initial deflection, (c) full bending deflection CFPR coupon, (d) sensors are attached to the underside of each coupon and plugged into a multimeter and flat cable.
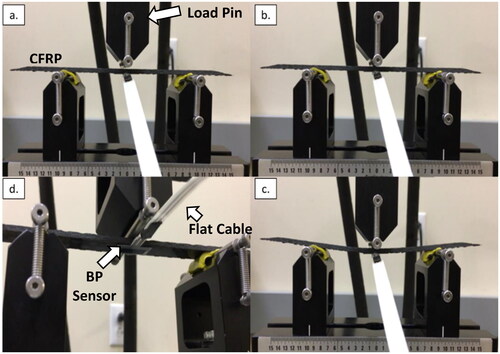
Table 1. List of experimental bending deflections and ensuing bending strain.
Figure 6. Schematic of the Wheatstone bridge characterization setup, where Vin = 3 V and RBP ≈ R2 = R3 = R4 to balance the bridge.
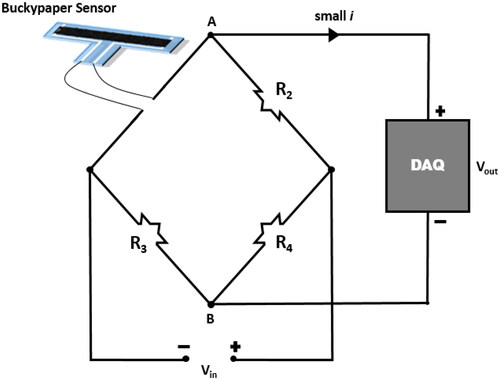
Figure 7. SEM images of (a) deformed CNT buckypaper containing a discontinuity; (b) high magnification of the discontinuity; (c) the edge of fracture CNT-BP; and (d) high magnification of overhanging bundles of CNTs along the edge.
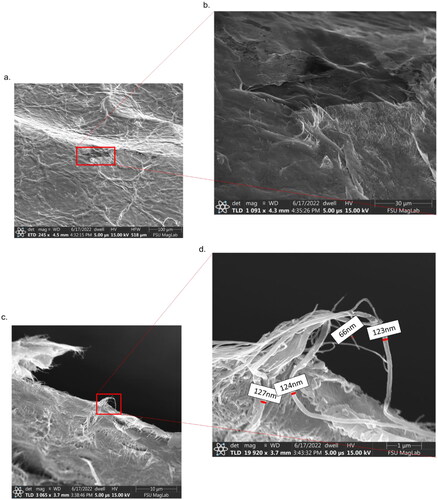
Figure 8. Flow of retrofitting CNT-BP sensors to damaged GFRP panels. (a) ASTM standardized; drop-weight impactor, (b) obscure damage from low-force impact, (c) microcracking on underside of GFRP panel, (d) attached CNT-BP sensor.
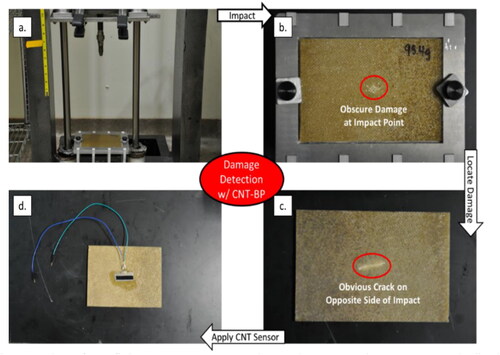
Figure 9. Ashby chart of the CNT-BP sensor and various materials according to elastic limit and elastic modulus.
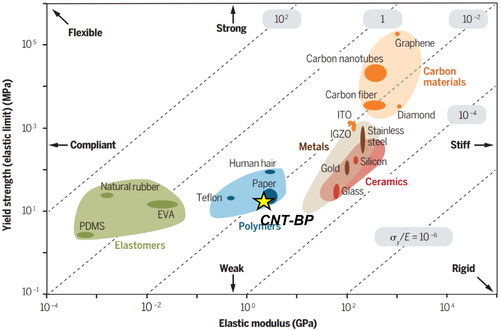
Figure 10. Resting resistance of CNT-BP sensors.
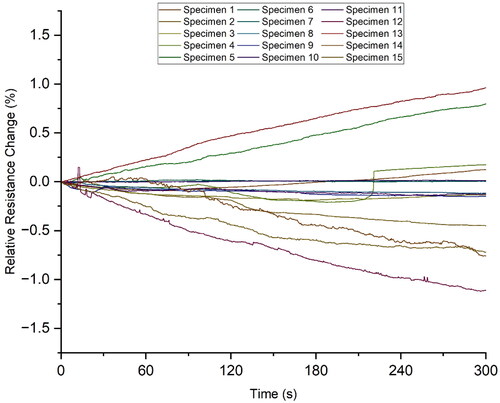
Figure 11. Potential calibration curve of CNT-BP strain sensing.
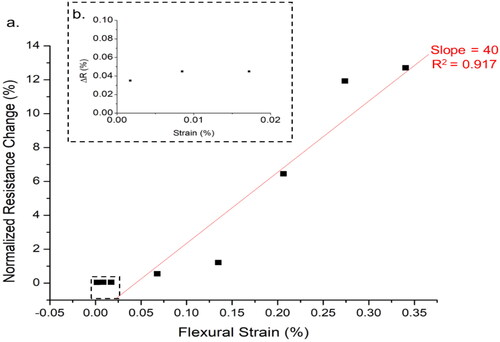
Figure 12. Output voltage response to 0.34% of cyclical strain (100 mHz) with plotted maximum and minimum voltage values. The regression slopes indicate good stability and consistency.
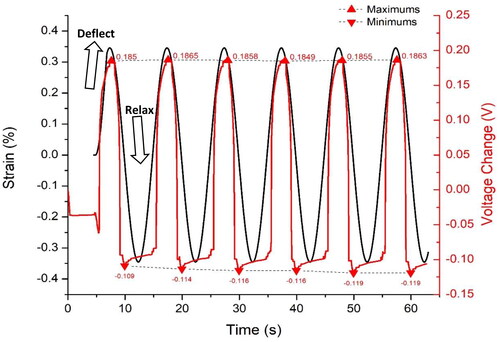
Figure 13. Printed BP strain gauge response to 10 μm and 100 µm of deflection.
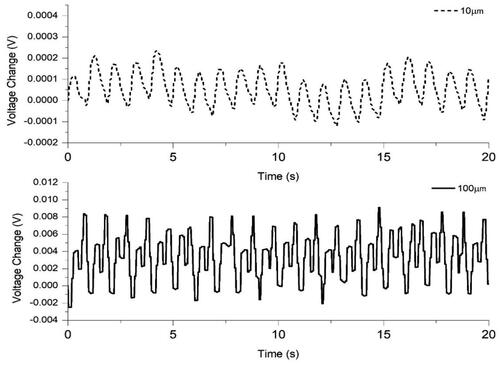
Table 2. Notable CNT-based stain gauges.
Figure 14. Illustration of hammer strike test on a laboratory workbench with attached sensor varied impact locations.
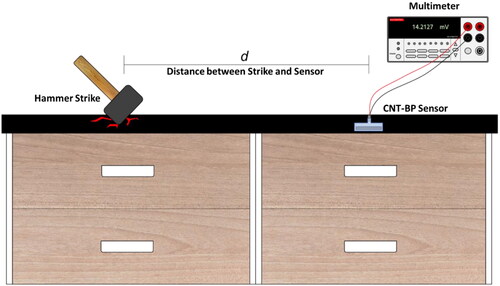
Figure 15. Plots of impact detection: a. voltage responses to single impacts at various distances; b. voltage responses to quick and successive hammer strikes; c. verification of detecting all five hammer strikes.
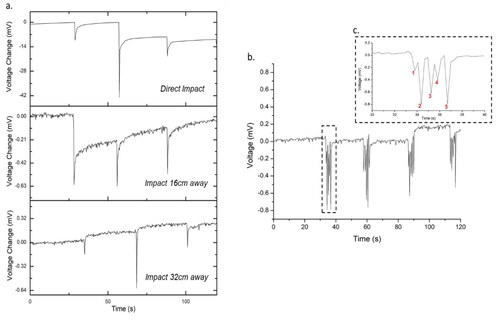
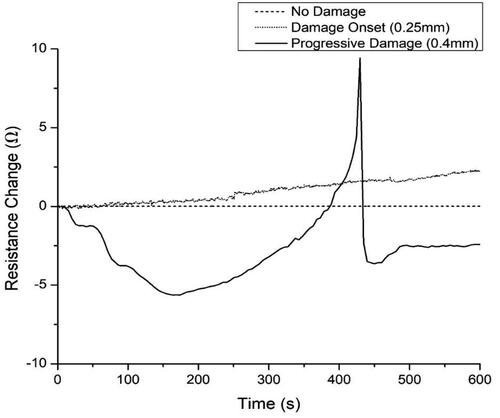
Figure 16. Comparison of passive sensory drift for pristine and damaged samples (dent depth = 0.15 mm).
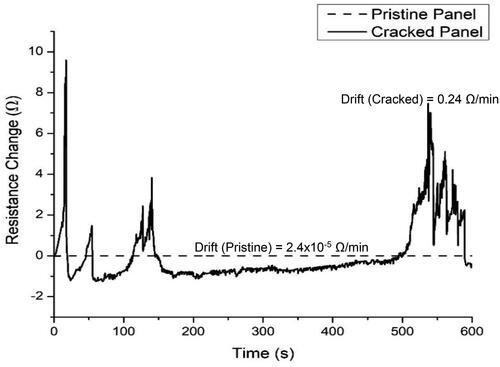
Figure 17. Three series of impact strikes; (a) baseline impact response to nondestructive impact, (b) impact response as 0.25 mm dent forms, (c) impact response as dent grew from 0.25 mm to 0.4 mm, (d) photos of progression of damage after onset (0.25 mm) and propagation (0.4 mm).
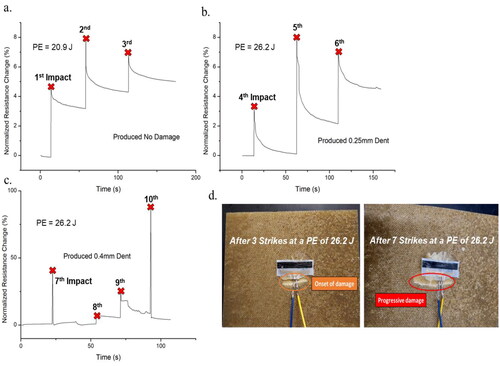
Figure 18. Detection of onset and progression of damage; (a) damage after one and four impact strikes; (b) passive sensory drift in response to damage, which can be quantified by the depth of the dent after impact.