Figures & data
Figure 1. FTIR spectra of chitosan, MNPs, Ch-MNPs, and Pb (II) loaded Ch-MNPs [Citation16].
![Figure 1. FTIR spectra of chitosan, MNPs, Ch-MNPs, and Pb (II) loaded Ch-MNPs [Citation16].](/cms/asset/4b716f92-2da7-4fcb-87d0-de199166e76b/ynan_a_2347804_f0001_c.jpg)
Figure 2. HR-TEM analysis represented the size and shape of Ch-MNPs (a–b). Arrows indicate the lattice fringes (b), (c) SAED pattern [Citation16].
![Figure 2. HR-TEM analysis represented the size and shape of Ch-MNPs (a–b). Arrows indicate the lattice fringes (b), (c) SAED pattern [Citation16].](/cms/asset/db0b60bf-63c4-4044-a931-54b85b91bf1e/ynan_a_2347804_f0002_c.jpg)
Figure 3. HR-SEM micrographs of Ch-MNPs before (a) and after Pb (II) adsorption (b) [Citation16].
![Figure 3. HR-SEM micrographs of Ch-MNPs before (a) and after Pb (II) adsorption (b) [Citation16].](/cms/asset/161da66f-a246-4ba7-a245-4b81d2b144ca/ynan_a_2347804_f0003_b.jpg)
Figure 4. EDX analysis (a) and elemental mapping representing the distribution of all elements (b), carbon (c), nitrogen (d), oxygen (e), manganese (f), and Pb (g).
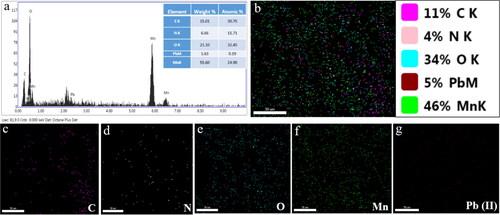
Figure 5. Effect of pH (a), initial Pb(II) concentration (b), Ch-MNPs dosage (c), temperature (d), contact time (e), and agitation rate (f) for Pb(II) adsorption onto Ch-MNPs.
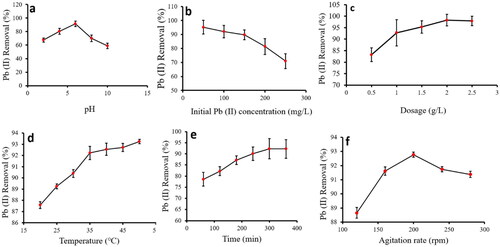
Figure 6. Langmuir (a), Freundlich (b), Temkin (c), and Halsey (d) isotherms of Pb(II) adsorption on Ch-MNPs.
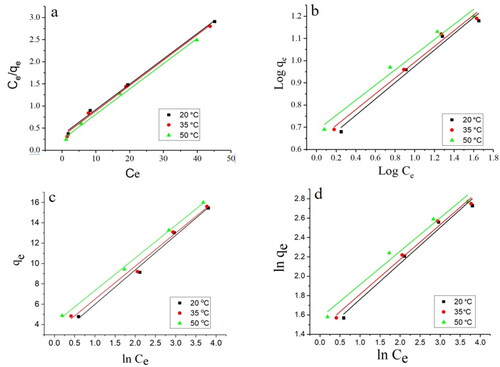
Table 1. The isotherm parameters of Pb(II) adsorption at various temperature.
Figure 7. PFO (a), PSO (b), and Elovich (c) kinetic models of Pb(II) adsorption onto Ch-MNPs.
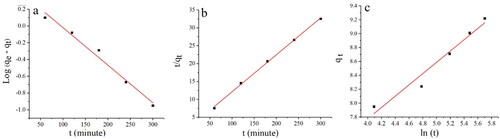
Table 2. Kinetics of Pb(II) adsorption.
Figure 8. Thermodynamics of Pb(II) adsorption.
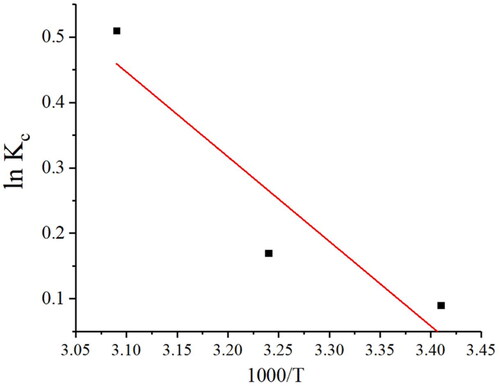
Table 3. Thermodynamic data for adsorption of Pb(II) on to Ch-MNPs.
Table 4. Comparison of Pb(II) removal capacity of Ch-MNPs with other nanoparticles.
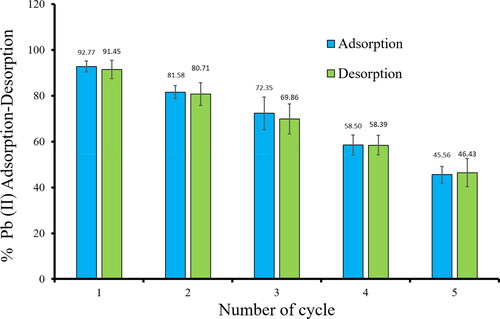
Figure 9. Pb(II) adsorption–desorption on Ch-MNPs.