Figures & data
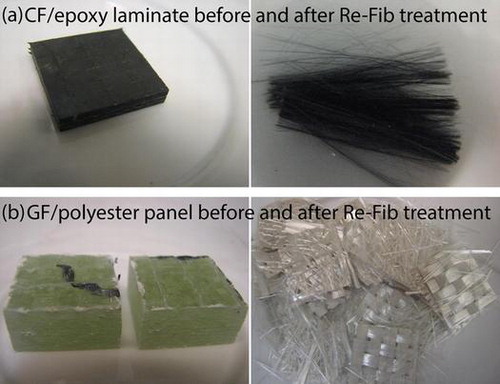
Figure 1 Sketch of Re-Fib process
Table 1 Details of compositions and processing conditions of rGF/rPP composites
Table 2 Residual solid content (RSC) of 24-h Re-Fib thermolysis at three temperatures
Table 3 Weight loss of different constituents of composite structures and of neat CF and GF
Figure 2 Appearance of (a) CF/epoxy laminates processed in SICOMP (Sweden) and (b) GF/polyester panel provided by Azimut Benetti (Italy) before (left) and after (right) Re-Fib treatment at 380 °C for 24 h
Figure 3 Appearance of sandwich structure composted of GF/polyester laminates and PU core: (a) before thermolysis, (b) after thermolysis at 340 °C for 24 h, (c) after thermolysis at 360 °C for 24 h, and (d) after thermolysis at 380 °C for 24 h.
Figure 4 Stress–strain curves of single-fibre tensile test in DMA at a force ramp rate of 0.1 N min−1 for CF and GF before and after optimal Re-Fib thermolysis (380 °C/24 h)
Table 4 Modulus and strength of single CF and GF measured in DMA
Figure 5 Fibre length distribution in injection molded test-bars from the rGF/rPP composite materials processed with three different screw configurations in the extrusion step