
Figures & data

Figure 1. Light microscopy image (left) and SEM image (right) of a printed sample.
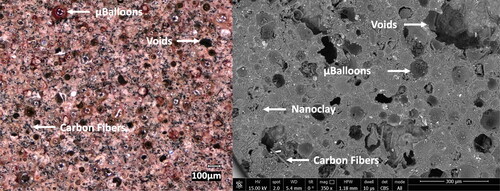
Table 1. Char yield values for samples with varying nanoclay concentrations.
Figure 2. Char yield curves of composite samples with various nanoclay contents.
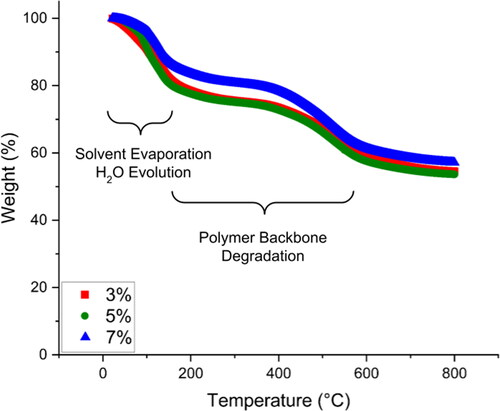
Figure 3. Viscosity as a function of temperature of composite samples.
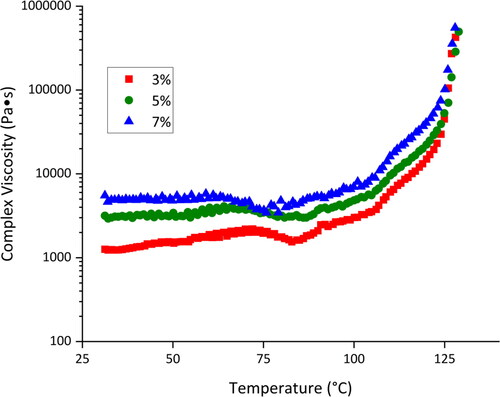
Table 2. The gelation temperatures of different samples with varying nanoclay contents.
Figure 4. Arrhenius plot used to calculate the activation energy of the composite polymerization.
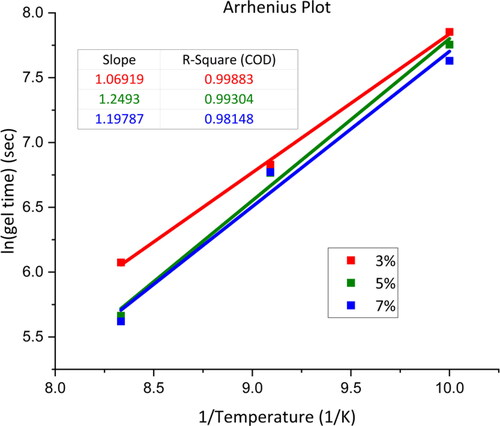
Table 3. Activation energies of the three different samples containing different amounts of nanoclay.
Figure 5. Stress-strain curves of with grain (left) and across grain (right) samples.
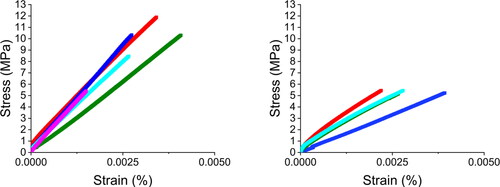
Figure 6. Ultimate tensile strengths and moduli of longitudinal and transverse orientations.
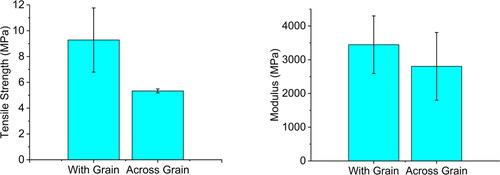
Figure 7. Printer modification with labeled axis. Arrows indicate positive direction of rotation or movement.
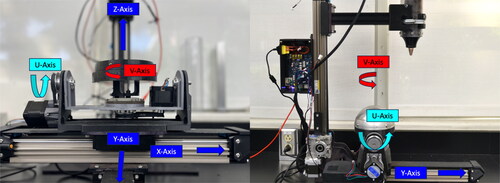
Figure 8. The modified 3D PotterBot 10 Micro printer with 5 axis control.
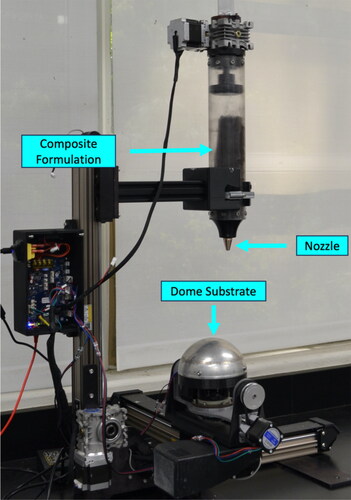
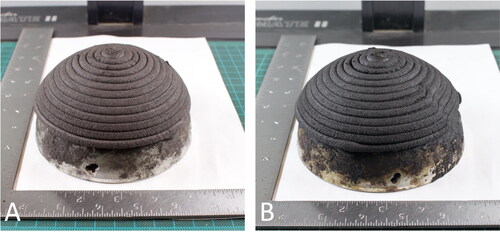
Figure 9. Composite dome produced via additive manufacturing from the composite formulation before cure (A) and after cure (B).
Supplemental Material
Download QuickTime Video (87.8 MB)Data availability statement
The authors confirm that the data associated with the results of this study are available within the article and its supplementary materials.