Figures & data
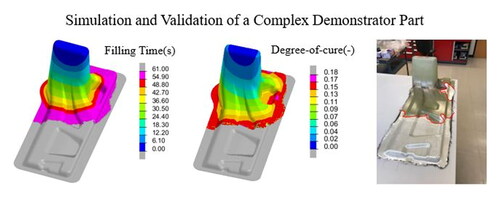
Figure 1. Schematic description of the CRTM process showing the two options for the resin and hardener mixture injection location (a) in the top gap, (b) in the bottom of the preform.
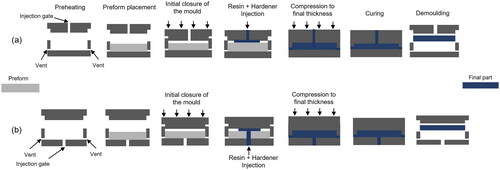
Figure 2. CRTM process simulation flow diagram showing the state variables [Citation30].
![Figure 2. CRTM process simulation flow diagram showing the state variables [Citation30].](/cms/asset/6eafc454-d0a3-4219-9d29-1e16f03cbb35/yadm_a_2378586_f0002_c.jpg)
Figure 3. Numerical procedure to solve fluid-solid coupled problem [Citation32].
![Figure 3. Numerical procedure to solve fluid-solid coupled problem [Citation32].](/cms/asset/0e640fd9-159e-41a5-a4f4-da586567270c/yadm_a_2378586_f0003_b.jpg)
Figure 4. Heat transfer preform-mould interface showing the temperature variation assumption across the interface [Citation30].
![Figure 4. Heat transfer preform-mould interface showing the temperature variation assumption across the interface [Citation30].](/cms/asset/ab5f2c14-cc5d-4b80-a10d-76834c31a290/yadm_a_2378586_f0004_c.jpg)
Table 1. Material and process parameters used in the simulations.
Figure 5. (a) In-plane and out-of-plane permeability and (b) fibre bed compaction response of TG15N NCF.
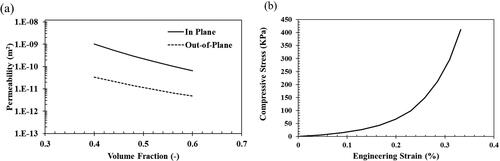
Figure 6. (a) CRTM mould setup for flat part, (b) TG15N NCF glass fibre preform, (c) location of sensors on the bottom mould, and (d) the schematic showing the location of the sensors.
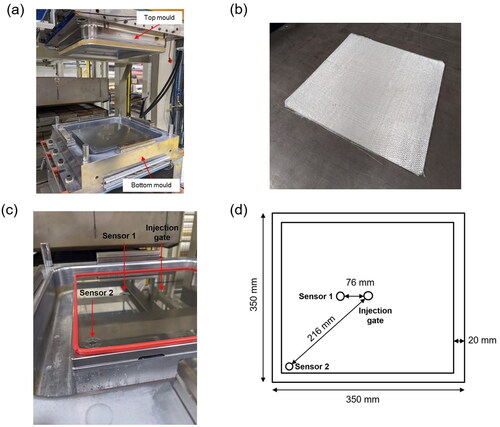
Table 2. Interrupted filling test matrix with corresponding time.
Figure 7. (a) Schematic of the simulation geometry representing 1/8th of the preform, and (b) meshed geometry of 1/8th section showing the modelling of the mould pinch area.
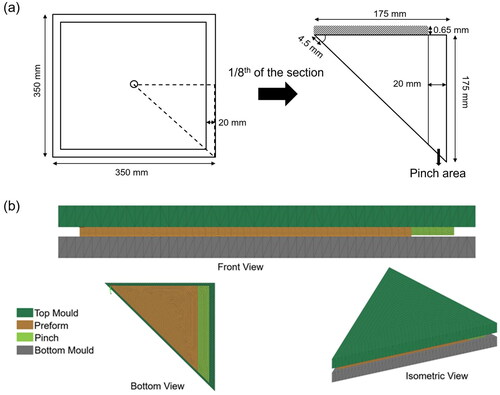
Figure 8. Schematic showing the assumption made during the modelling of the CRTM process, (a) injection of resin and hardener with the inclusion of the gap and, (b) injecting considering preform decompression by adjusting the preform fibre volume fraction eliminating the gap.
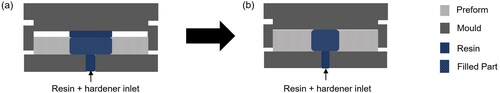
Figure 9. Front view of the geometry of 1/8th section of the model with the inclusion of the gap to check for preform decompression.
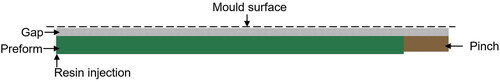
Figure 10. The results showing the effect of decompression of the preform (displacement in mm) with the progression of the flow front.
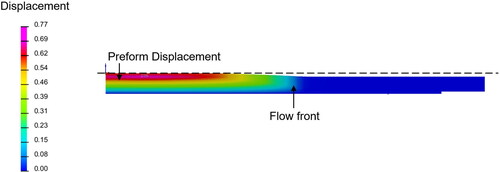
Figure 11. Progression of flow front at different time intervals: experiment vs simulated flow patterns with fill factor at (a) 5 s, (b) 30 s, (c) 60 s (end of injection) and (d) simulation predicting the deviation observed at the transition of preform and the pinch section at the end of injection (60 s).
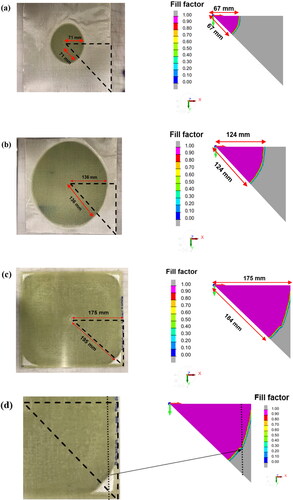
Figure 12. Flow front diagonal distance comparison between experiment and simulation.
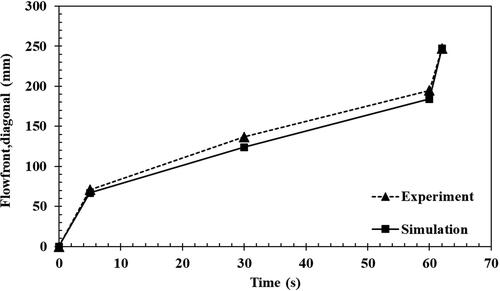
Figure 13. Pressure and temperature data recording of the two sensors for the entire CRTM process: preheating, injection compression and curing. The x-axis has been segmented to show the scale only for injection-compression phase.
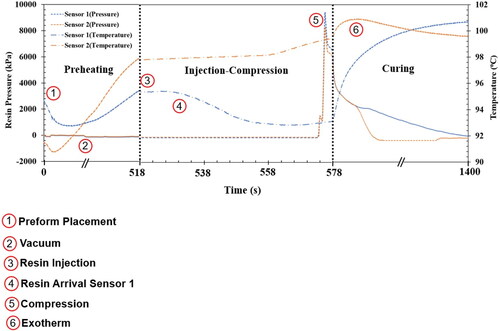
Figure 14. (a) Schematic showing the location of the two sensors on the 1/8th section of the part. (b) Placement of virtual sensors at the same location on the model geometry in PAM-RTM.
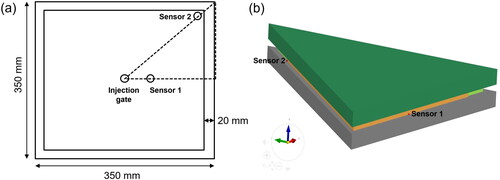
Figure 15. (a) Comparison between the simulation and experimental data of temperature for both sensors during the (a) injection-compression and (b) curing phase. (c) Comparison between simulation and experimental data of pressure during injection-compression phase.
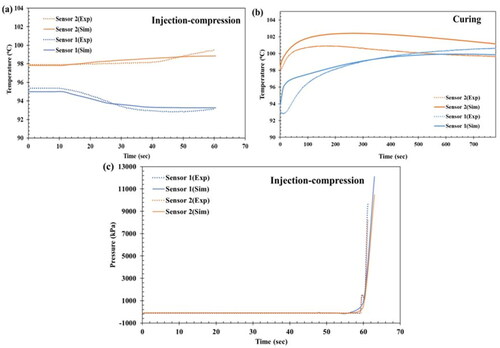
Figure 16. (a) Welded steel assembly and the corresponding composite design, and (b) meshed mould and preform geometry with injection gate and vent locations.
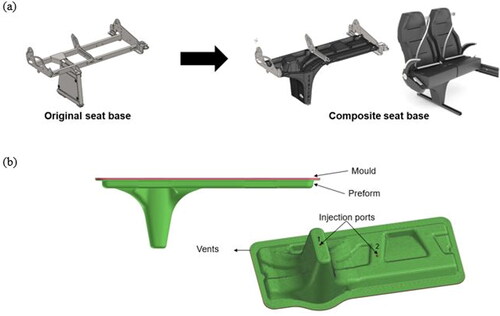
Figure 17. Simulation showing resin injected simultaneously using two ports and the corresponding final part produced based on the simulation.
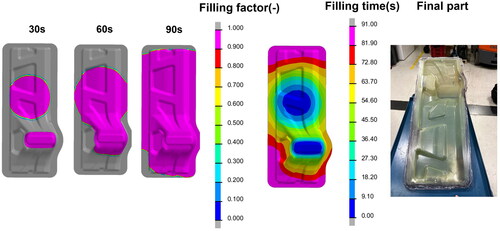
Table 3. Material and process parameters used for the demonstrator simulations.
Figure 18. Filling time, degree of cure and viscosity development for single port injection at the end of compression sequence (281 s).
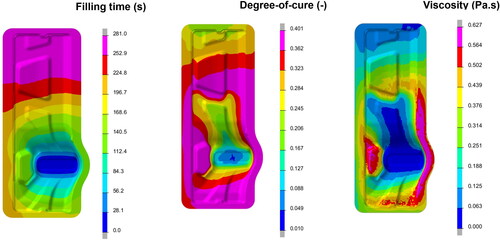
Figure 19. Short shot test for comparing the experimental and simulation results for the demonstrator at an injection time of 60 s followed by compression.
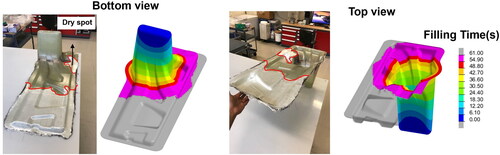
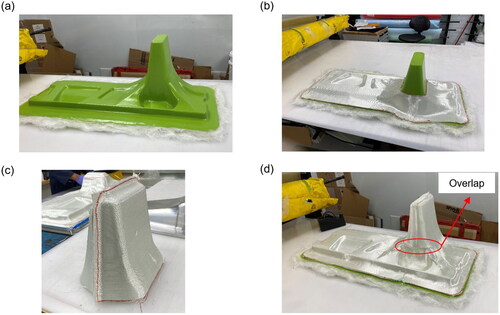
Figure 20. (a) 3d Printed seat base plug on which the preform will be draped, (b) first part of the preform draped on the seat base plug, (c) second part (foot) of the seat base preform, and (d) completed draping of preform on the plug with an overlapped section.