Figures & data
Figure 1. Catalytic activity of xNi–yCu–ZrO2 catalysts prepared with different compositions and reduction temperatures. Reaction conditions: 200 °C, 35 bar H2, 30 min, 5 wt.% LA/H2O, catalyst (0.05 g).
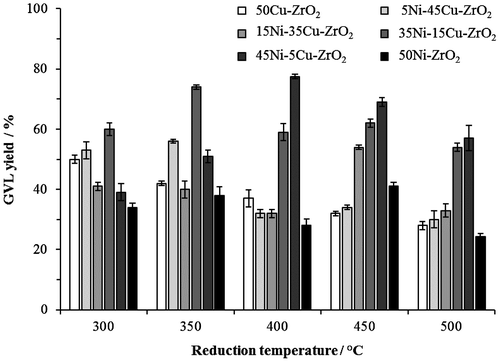
Figure 2. Time-on-line data for xNi–yCu–ZrO2 prepared with different Ni–Cu compositions reduced at 400 °C. Reaction conditions: 200 °C, 35 bar H2, 5 wt.% LA/H2O, catalyst (0.05 g) ●: 50Cu–ZrO2 (pre-reduced at 300 °C); ■: 5Ni–45Cu–ZrO2; ▲: 15Ni–35Cu–ZrO2; Δ: 35Ni–15Cu–ZrO2; □: 45Ni–5Cu–ZrO2; ○: 50Ni–ZrO2.
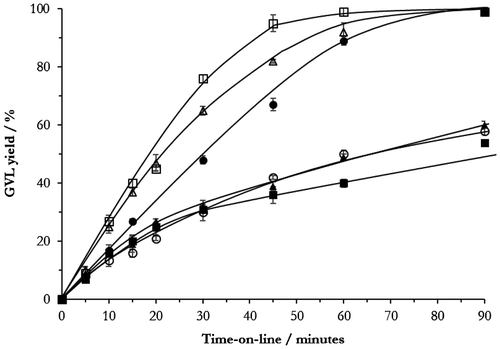
Table 1. Initial rates and TONs for Cu–ZrO2, Ni–ZrO2, and xNi–yCu–ZrO2 catalysts.
Figure 3. Dependency of GVL yield on reagent concentrations for determining reaction order for (a) LA, and (b) H2. Reaction conditions: in both cases 200 °C, 30 min reaction, 45Ni–5Cu–ZrO2 reduced at 400 °C (0.05 g). For (a) 35 bar H2, and for (b) 5 wt.% LA/H2O.
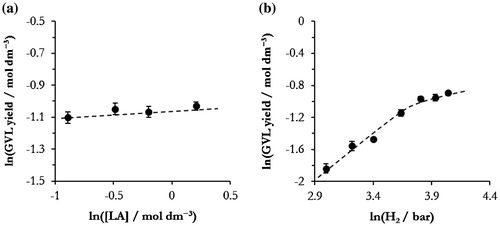
Figure 4. XRD patterns of xNi–yCu–ZrO2 catalysts, reduced at 400 °C and 50Cu–ZrO2 reduced at 300 °C. (a): Full diffraction pattern; (b): diffraction pattern zoomed to show 2θ = 42–46° traces are aligned with the material of the same composition in (a). Reflections due to known phases are marked as: ●: ZrO2; ▲: NiO; ■: Ni; ▼: Cu; ♦: Cu–Ni.
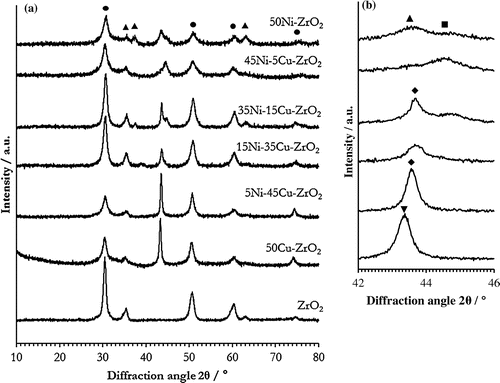
Table 2. Physical properties of materials xCu-yNi–ZrO2.
Figure 5. TPR profiles of xNi–yCu–ZrO2 catalysts, compositions as indicated for each trace.
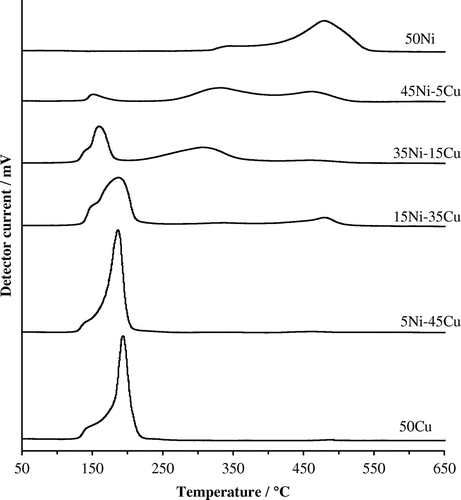
Table 3. XPS analysis of xNi–yCu–ZrO2 catalysts.
Figure 6. DOS plots for bulk Ni (solid line), Ru (dashed line), and Cu (dot-dash line). Calculated d-band centres (in eV) are shown as dotted vertical lines labelled by metal type. Spin up states are shown as positive and spin down negative DOS values.
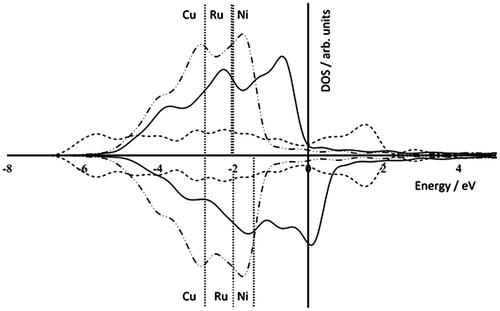
Figure 7. Calculated d-band centre as a function of Ni mole fraction in a 2 × 1 supercell of bulk Cu. Spin up (dotted line) and spin down (solid line) contributions are plotted separately, asymmetry between d-band centres becomes more pronounced as the mole fraction of Ni is increased.
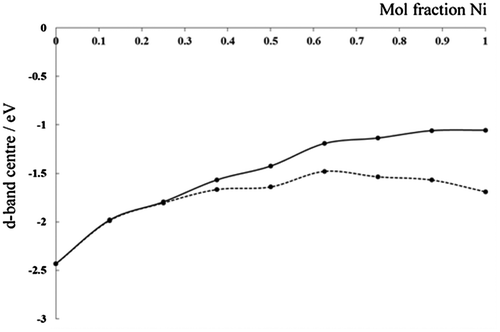
Figure 8. XRD patterns of 45Ni–5Cu–ZrO2 before and after reaction. ●: ZrO2; ▲: NiO; ■: Ni; ▼: Cu; ♦: Cu–Ni.
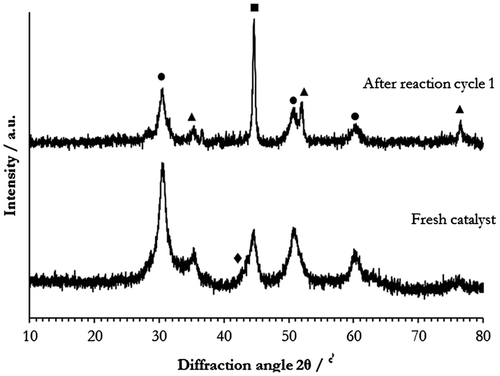
Table 4. Metal leaching from the xNi–yCu–ZrO2 catalyst in the post-reaction solution obtained by MP-AES.
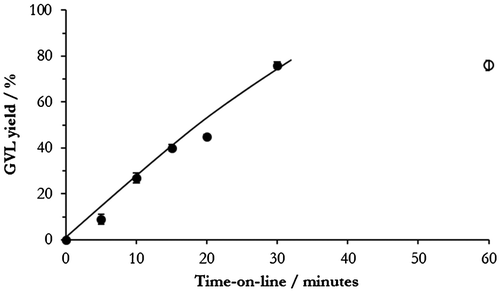
Figure 9. The effect of leached metal on GVL yield. ●: 45Ni–5Cu–ZrO2 catalyst present (0.05g); ○: 45Ni–5Cu–ZrO2 removed after 30 min. Reaction conditions: 200 °C, 35 bar H2, 5 wt.% LA/H2O.