Figures & data

Figure 1. The TEM images of the (a) carbon nitride and (b) Au-CN.
Figure 2. X-ray diffraction (XRD) patterns of (a) CN and (b) Au-CN. (c) High-resolution X-ray photoelectron spectrum with two distinct peaks at 87.7 and 84.0 eV is due to the spin-orbit splitting of the Au 4f5/2 and Au4f7/2 lines, respectively.
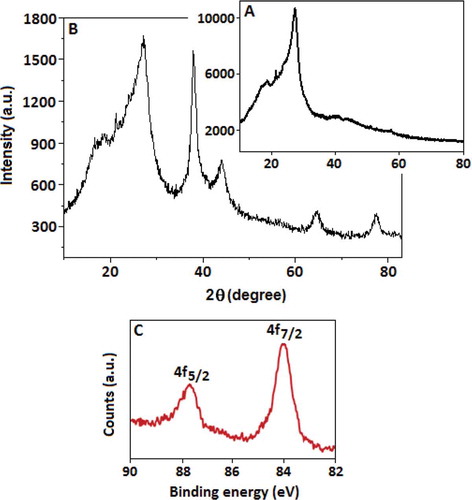
Figure 3. (A) FTIR spectra of (a) CN and (b) Au-CN. (B) The photoluminescence (PL) spectra of (a) CN and (b) Au-CN.
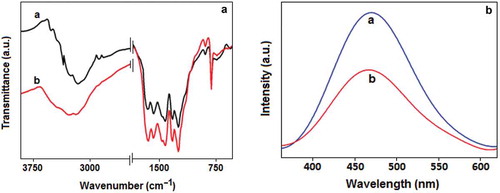
Figure 4. (A) Nitrogen adsorption and desorption isotherms and (B) pore size distribution of the (a) CN and (b) Au-CN.
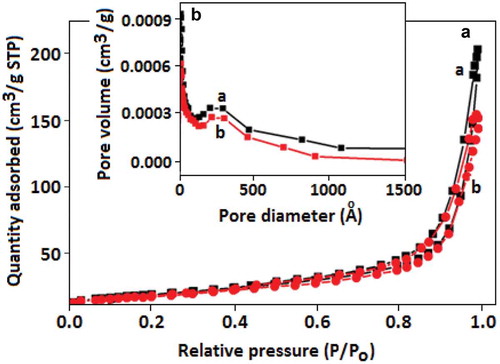
Figure 5. (A) The electrochemical impedance spectroscopy analysis using Nyquist plots for the (a) CN and (b) Au-CN in KOH (0.5 mol dm–3) within the frequency range from 3 MHz to 10 Hz. (B) Magnified spectra of the high-frequency area. (C) The equivalent circuit model of the electrochemical impedance spectra.
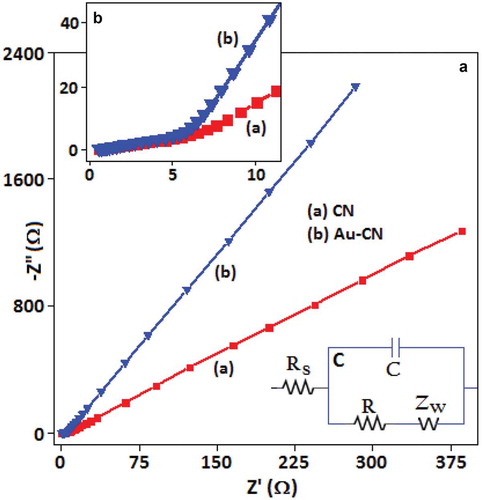
Figure 6. (A) Cyclic voltammogram of carbon nitride-modified GCE in the absence (curve ‘a’) and presence (curve ‘b’) of methanol (1.0 mol dm–3). (B) Cyclic voltammogram of Au-CN-modified GCE in the absence, curve (c), and the presence, curve (d), of methanol (1.0 mol dm–3). Both the experiments were carried out in the presence of KOH (0.5 mol dm–3).
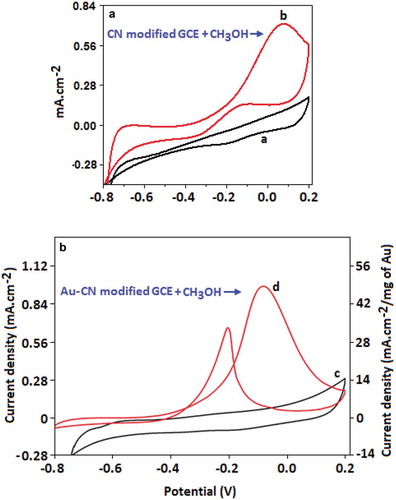
Figure 7. Cyclic voltammogram of Au-CN-modified glassy carbon electrode represents the increasing current density value with every scan (for 100 scans) in the presence of methanol (1.0 mol dm–3) and KOH (0.5 mol dm–3). Two arrows indicate the gradual shifting of the peak positions toward the higher potential range with the increase of current density.
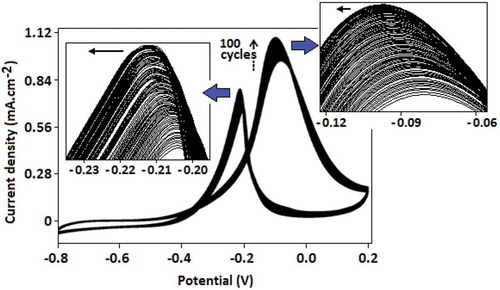
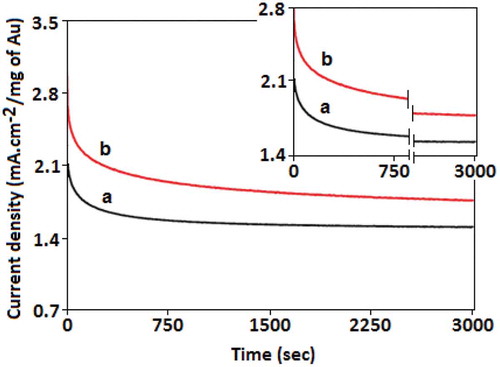
Figure 8. Chronoamperometry study of CN, amperometric curve (a), and Au-CN, amperometric curve (b), modified GCE in the presence f of methanol (1.0 mol dm–3) and KOH (0.5 mol dm–3) at – (0.80) V for 3000 s.