Figures & data
Figure 1. The production of an acoustic figure through Chladni’s experimental method of putting a plate covered in sand into vibration, here employing a violin bow to cause the agitation. (From Tyndall Citation1867, 142). Image in author’s possession, 2019).
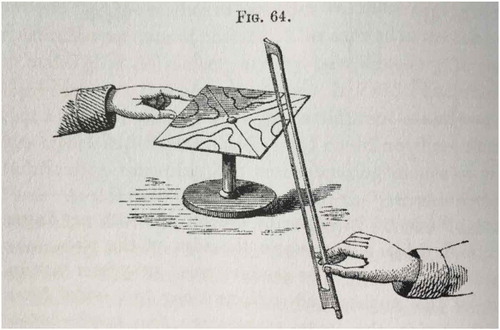
Figure 2. Acoustic figures from Charles Wheatstone’s experiments, published in 1833 (Image in author’s possession, 2019).
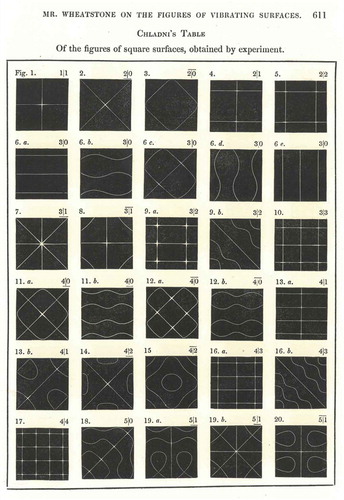
Figure 3. Mallet’s “line of shock” from an earthquake, as it moved through a ruined church. (From Mallet Citation1848, 51–105, 54). Reproduced with permission of the Institute of Astronomy Library, Cambridge, 2019).
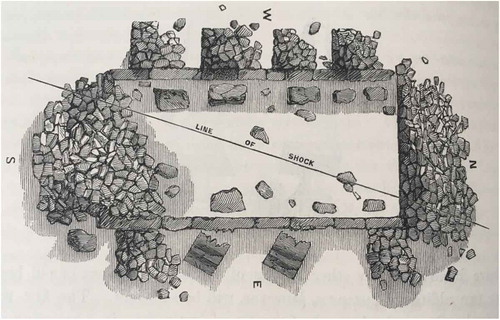
Figure 4. Mallet’s diagrams to show the movement of a shock wave from the epicentre of an earthquake. (From Mallet Citation1848, 51–105), Plates I, II, and III. Reproduced with permission of the Institute of Astronomy Library, Cambridge, 2019.
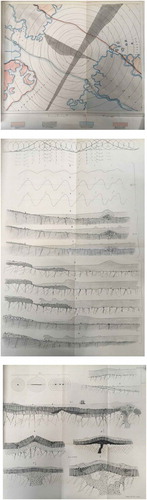
Figure 5. Mallet’s illustration of the manner in which earthquake shock waves caused building stones to twist, while remaining within an architectural structure. (From Mallet Citation1848, 51–105, 53). Reproduced with permission of the Institute of Astronomy Library, Cambridge, 2019.
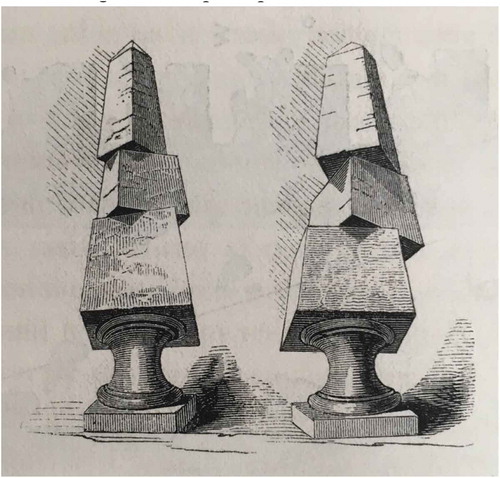
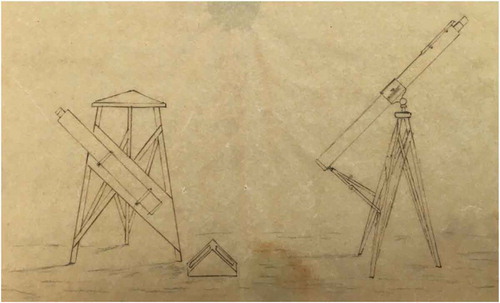
Figure 6. Airy’s collimater arrangement to measure vibrations from passing trains. The collimator is on the left and the telescope on the right, both angled towards the triangular trough containing mercury. (From Cambridge University Library, RGO/6/50, p. 302. Image reproduced with permission of the university library, 2019).