Figures & data
Figure 1. Reverb scheme. Courtesy of Author.
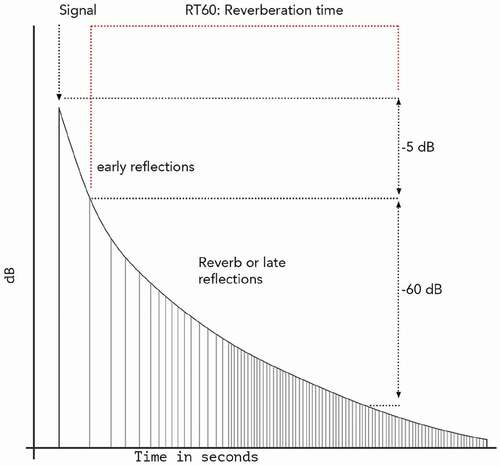
Figure 2. Basement scheme. image credit to Khiyam.com.
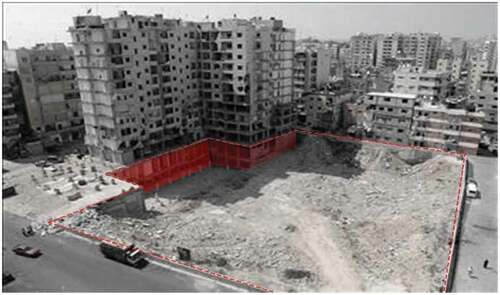
Figure 3. Bombardment spectrogram. Courtesy of Author.
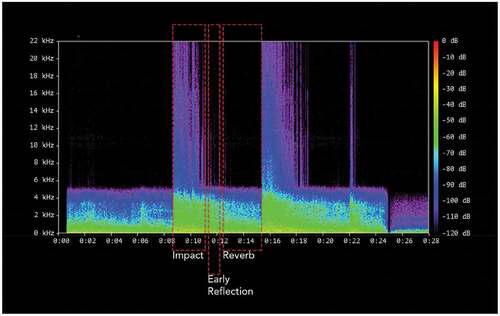
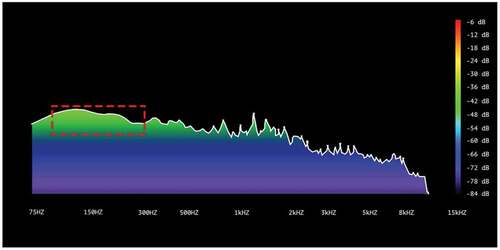
Figure 4. Impact frequency analysis. Courtesy of Author.
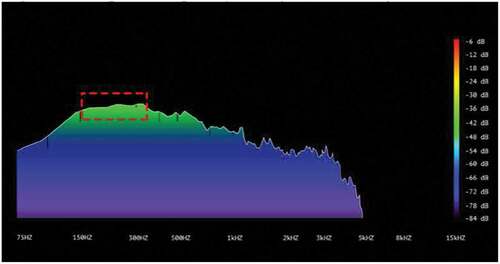
Figure 5. Site image of pile driver. image credit to al-akhbar.com.
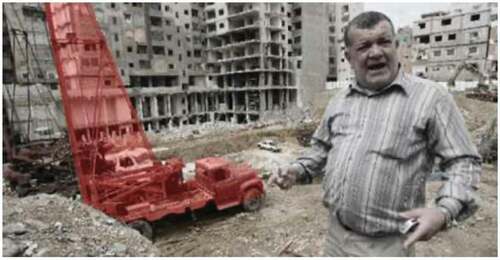
Figure 6. Spectrographic comparison between the bombardment and the pile driver. Courtesy of Author.
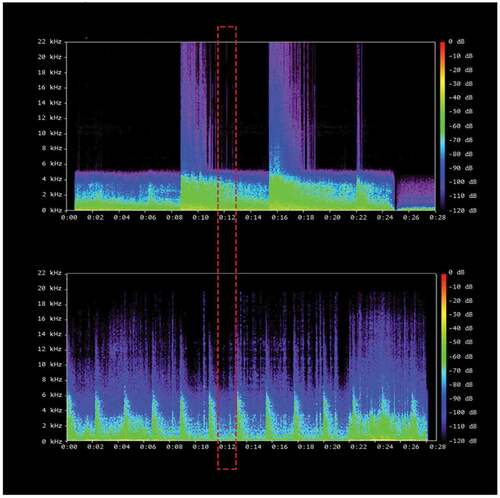
Figure 7. Frequency analysis of the pile driver’s reverb. Courtesy of Author.
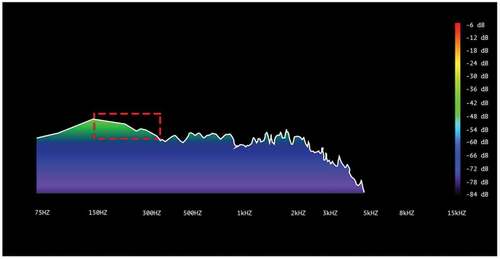
Figure 8. Environmental Noise spectrogram from recordings in Beirut and the Suburb. Courtesy of Author.
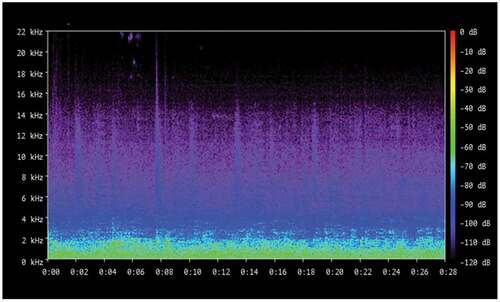
Figure 9. Frequency analysis of environmental noise. Courtesy of Author.
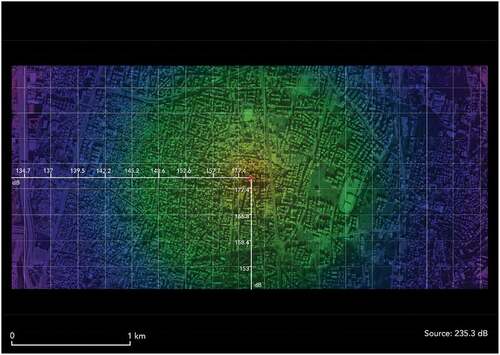
Map 1. Noise intensity prediction map. Courtesy of the Author.
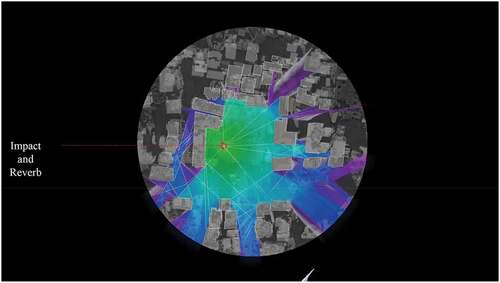
Map 2. Reverb simulation. Courtesy of the Author.