Figures & data
Table 1. Factor and levels of formulation.
Table 2. Response surface regression: analysis of variance.
Figure 1. Response surface plot and counter plot of relationship between A:ca3(po4) and B:trehalose on entrapment efficacy(I & II) and in vitro drug release (III & IV) of formulation.
Indicates the magnitude of entrapped efficacy (%), Contour lines: Represent levels of drug release (%) corresponding to different combinations of Factor 1 and Factor 2.
ca3(po4): Calcium phosphate, color scale.
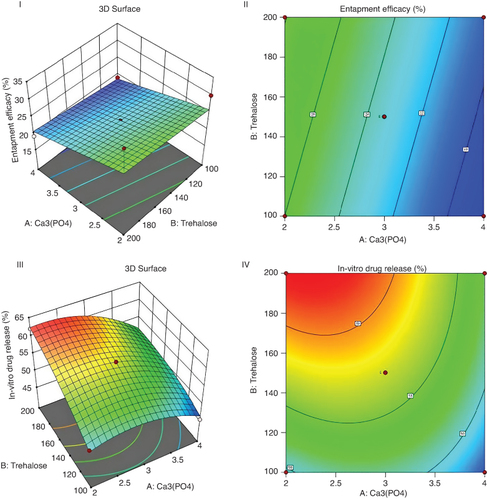
Table 3. FTIR peaks of calcium phosphate core, Trehalose coated core and cephalothin-loaded aquasome.
Figure 2. SEM (left panel) and EDX (right panel) analysis of calcium phosphate core (A), trehalose coated core (B) and Cephalothin loaded aquasome (C).
SEM, which shows the presence of spherical calcium phosphate core in the nano range.
μm: Micrometer; KeV: Kilo-electron volt; SEM: Scanning electron microscopy.
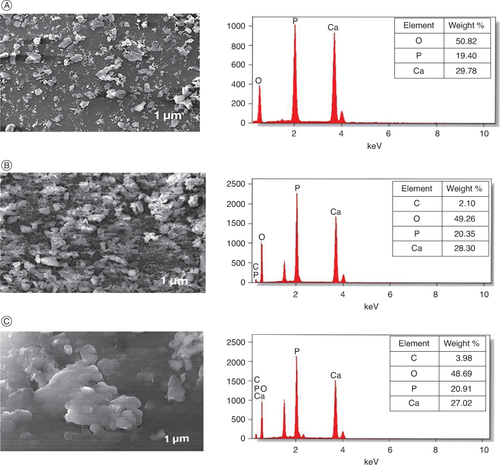
Table 4. Particle size of calcium phosphate core, Trehalose coated core and cephalothin-loaded aquasome.
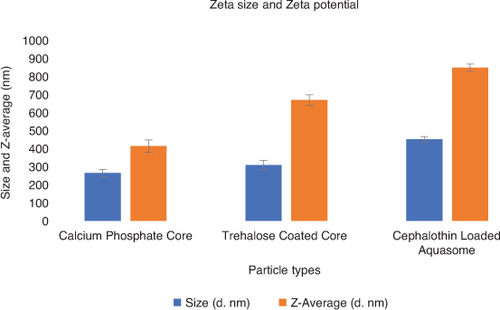
Figure 3. The size and Z-Average of calcium phosphate core, Trehalose coated core and cephalothin-loaded aquasome.
Comparison of particle sizes in each step of preparing drug loaded aquasomes.
nm: Nanometer.