Figures & data
Figure 1 Minard’s chart of Napoleon’s Russian Campaign
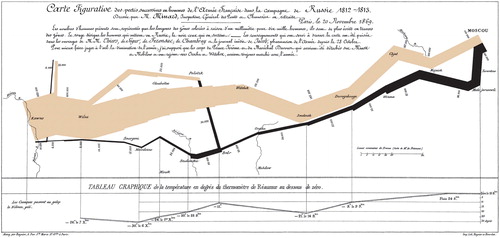
Figure 2 Probability dots

Figure 3 Shipman: death in the afternoon. From Professor Richard Baker “Harold Shipman’s Clinical Practice, 1974–1998.” London: HMSO, 2001. Contains public sector information licensed under the open government licence v3.0
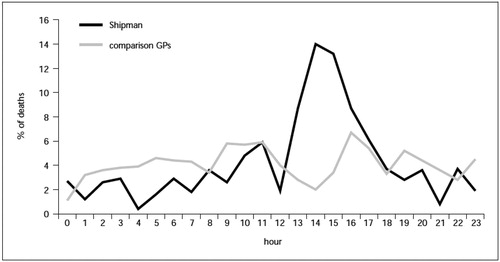
Figure 4 Snow’s London Cholera Map
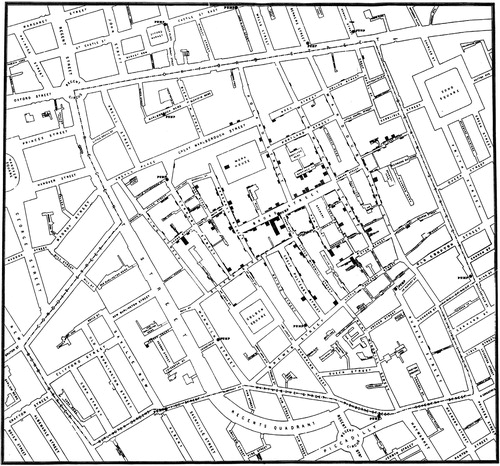
Figure 5 Nightingale’s diagram of mortality in the Army in Crimea
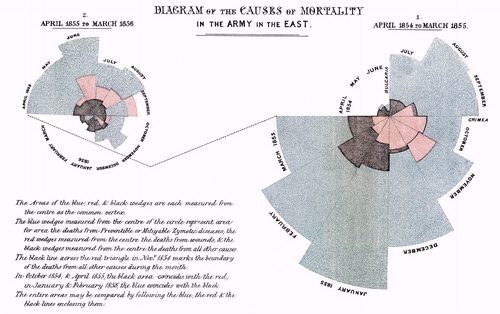
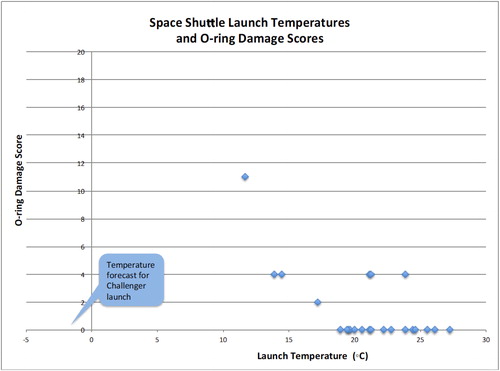
Figure 6 Space shuttle O-ring damage and launch temperature