Figures & data
Figure 1 Stock/Flow Diagram Illustrating the Person-to-Person Sector of The Model
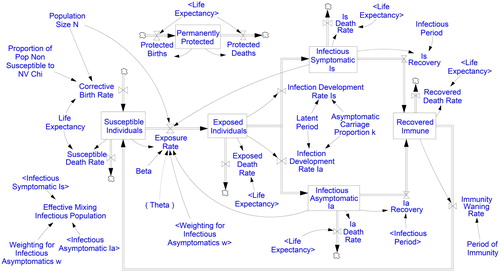
Figure 2 Stock/Flow Diagram of The ‘Bivalve Shellfish’ Sector of the Model
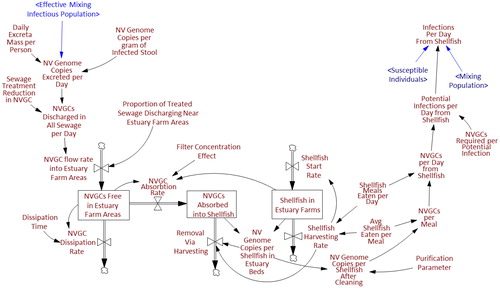
TABLE 1 A 2 × 2 ORGANISING FRAMEWORK FOR THE PARAMETERS IN THE MODEL
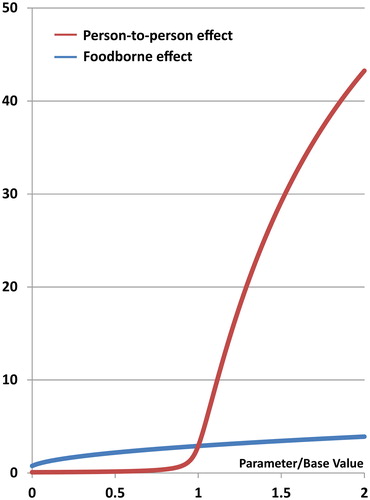
Figure 3 Norovirus Observed Incidence Rate (Millions Cases/Year)