Figures & data
Figure 1: The impact of colonial policies on African labour supply and real wages
Note: Inspired by Frankema & van Waijenburg Citation2012.
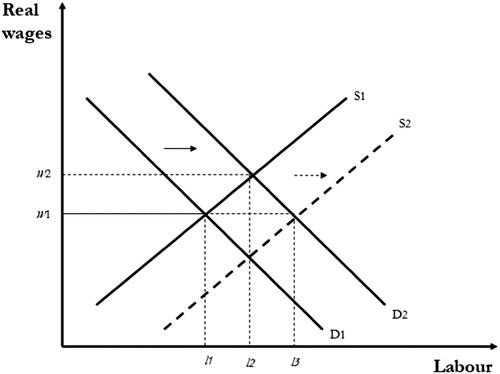
Figure 2: Earnings in the European agricultural sector in pounds, 1920–45
Sources: Authors’ own calculations. Production and export values are taken from the Agricultural Department annual report 1920–45; Employment and wages are taken from the Native Affairs Department, Labour Department annual reports 1920–45 and from Mosley (Citation1983); Import values are taken from the Annual Trade Reports 1920–45. Notes: The preferred measure uses production values for coffee, maize, and wheat and export values (deducted by 15% to take into account transaction costs) for sisal, tea, sugar, potatoes, cotton, and coconuts to calculate revenue. Our robustness check use data on export values only deducted by 15% to take into account transaction costs. In both cases, we deduct curing charges from coffee values.
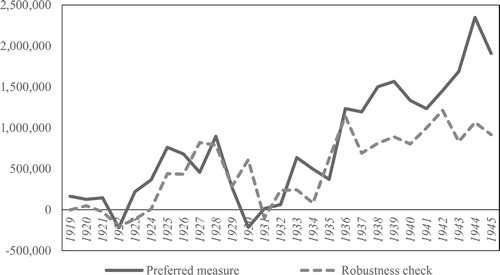
Figure 3: Land productivity for coffee and maize (measured as yields in lb per acre), 1921–44
Source: Authors’ own calculations. Data is taken from the Agricultural Department annual reports 1921–44. Note: Yields are calculated using data on European production of clean coffee and maize and European coffee and maize acreages.
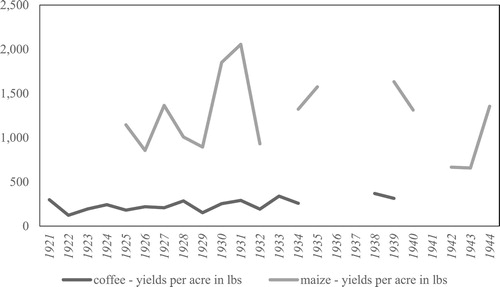
Figure 4: Labour productivity index measured as output per worker for the entire settler agricultural sector (deflated by coffee price index), 1920–45
Source: Production, export values, and coffee prices are taken from the Agricultural Department annual report 1920–45; Employment and wages are taken from the Native Affairs Department and Labour Department annual reports 1920–45 and from Mosley 1983. Notes: Labour productivity is calculated by dividing an index of value of output (deflated by a coffee price index) by the index of total employment in agriculture. The total employment measure includes both wage workers and tenants.
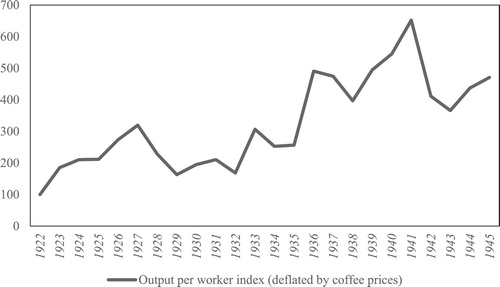
Figure 5: Welfare ratio – based on the annual income of an adult male agricultural worker, 1912–45
Source: Authors’ own calculations. Wages are taken from the Blue Books 1912–30, Native Affairs Department 1930–45, and Mosley 1983. Rural commodity prices are taken from the Central/Kikuyu and Nyanza Province annual reports 1912–45. Prices for imported are taken from the Blue Books and Trade Reports 1912–45. Notes: (1) Standard methods are used to calculate the welfare ratio (see Frankema & Waijenburg Citation2012; Allen 2013; de Haas Citation2017). (2) Caloric content is taken from Latham Citation1997. (3) Similar to de Haas (Citation2017), we include beans and we allow the family to choose the cheapest grains variety (maize, millet or sorghum). Following Frankema and van Waijenburg (Citation2012), we add 10% to the cost of the basket to take into account firewood/charcoal and candles, as data for these items is missing. In addition, a 5% mark-up is also added to account for the cost of maintaining a rural dwelling.
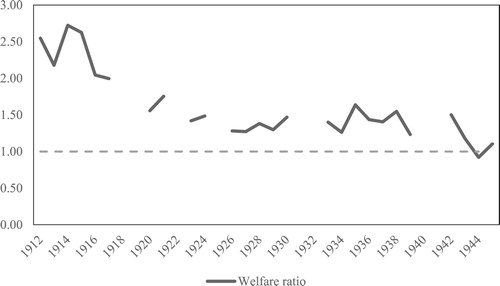
Figure 6: Labour composition on European farms, 1928–37
Sources: Data on tenant and short-term workers is taken from the Agricultural census 1928-1937. The number of long-term workers (referred to as ‘contracted workers’ in the colonial records) is taken from the Native Affairs Department annual reports 1928-1934; for 1931, 1935. For 1936 the source is Fearn 1961. Notes: (1) For 1931, 1935, and 1936, we only have data on long-term workers from the Nyanza Province. This should not cause interfere with our results and conclusions, as the vast majority of long-term workers came from the Nyanza Province. (2) Due to lack of data, the number of tenant labourers is interpolated using a log-linear approach for the years 1930, 1931, 1935, and 1937. (3) Tenant workers are not reported separately from wage workers before 1927 (Mosley Citation1983). We are therefore not able to extend our time-series back. Another concern is the manner in which long-term workers are recorded: these are reported as ‘contracted labour’ but the administrative reports do not distinguish between contracted labour in industry and in agriculture. Thus, we might be overestimating the role of migrant labour slightly. This does not affect our conclusion, that short-term and tenant labourers were the most important sources of labour.
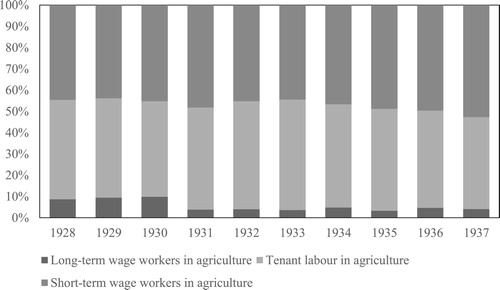
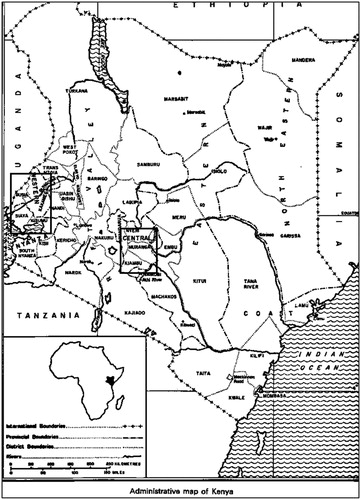
Figure 7: Administrative map of Kenya
Source: ILO (1972) ‘Employment, incomes and equality’ Note: ▭ Main labour supplying area.