
Figures & data
Figure 1. HIV prevalence in Southern Africa from 1990 to 2019. Data source: World Bank Data (Citation2020).
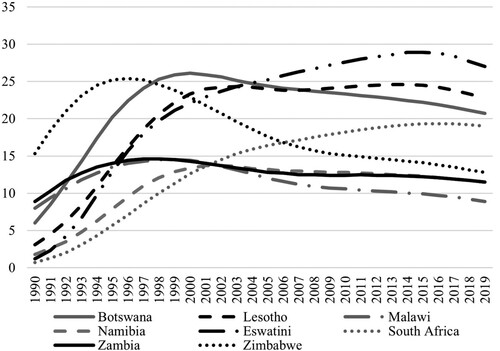
Figure 2. Demographic Health Survey (DHS) cluster locations.
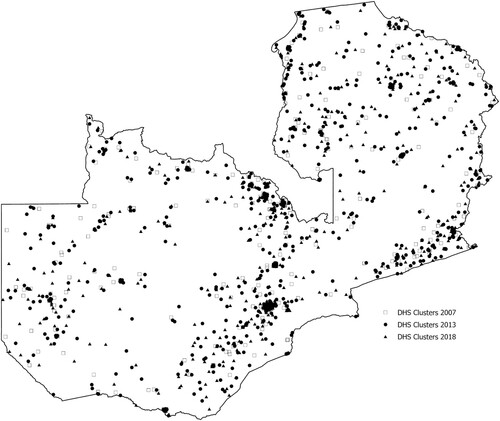
Figure 3. Protestant and Catholic missionary churches in Northern Rhodesia, 1948.
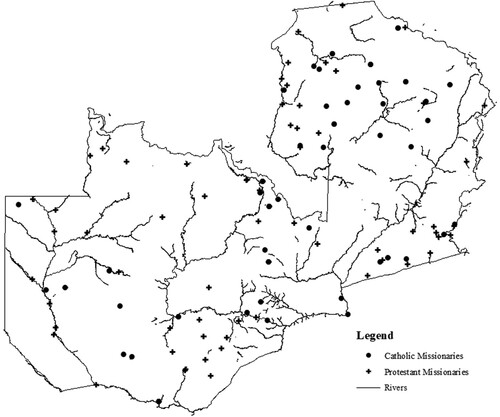
Figure 4. Protestant and Catholic mission health centres in Northern Rhodesia, 1953.
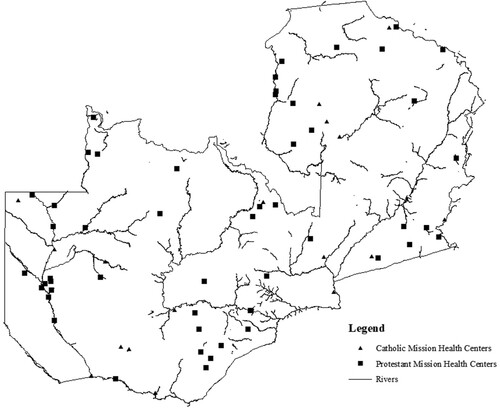
Table 1. Christian missions and Human Immunodeficiency Virus (HIV) infection.
Table 2. Christian missions and HIV infection in urban and rural areas.
Figure 5. Correlation between current health centres and missionary health centres and stations in Zambia.
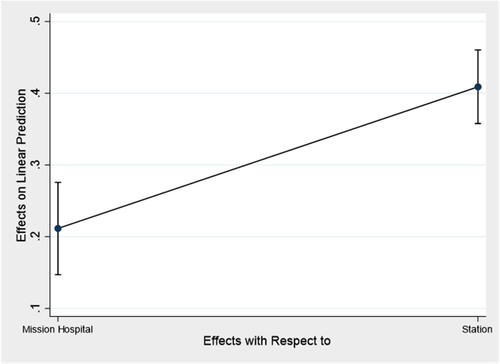
Table 3. Impact of proximity to a mission church on sexual behaviour.
Table 4. Impact of proximity to a mission health centre on sexual behaviour.
Figure 6. Cagé and Rueda missions (Citation2020) versus new geocoded (1948) missions for Zambia.
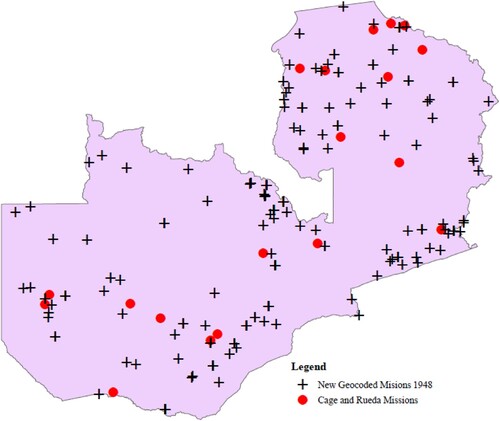
Table A1. Descriptive statistics for geocoded DHS data.
Table A2. Protestant and Catholic missionaries and HIV infection.
Table A3. Christian missions and the heterogeneous impact on HIV infection.
Table A4. Heterogeneous effect of Christian missions and lifetime sex partners.
Table A5. Heterogeneous effects of Christian missionaries on premarital abstinence.
Table A6. Heterogeneous effect of Christian missionaries on age at first sex.
Table A7. Heterogeneous effect of Christian missionaries on condom use at first intercourse.
Table A8. Oster test for Christian missionary impact on HIV infection.
Table A9. Comparison between author geocoded missions and Cagé and Rueda (Citation2020) missions.