Figures & data
Figure 1: Framework for the prevention and containment of antimicrobial resistance in South African hospitals. Source: National Department of Health, South Africa: 2018.Citation5
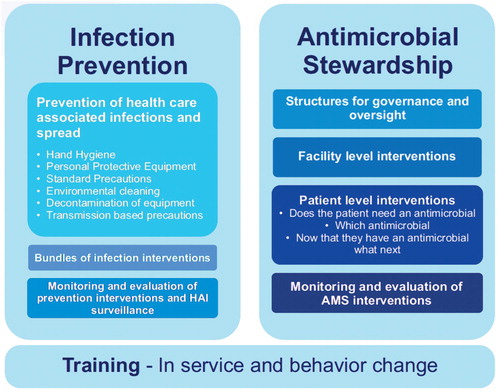
Figure 2: Mossel Bay Hospital multidisciplinary team during an AMS ward round. From left to right: family medicine registrar, professional nurse, family medicine registrar, community service pharmacist, family physician and clinical pathologist. Source: lead author, 2018.
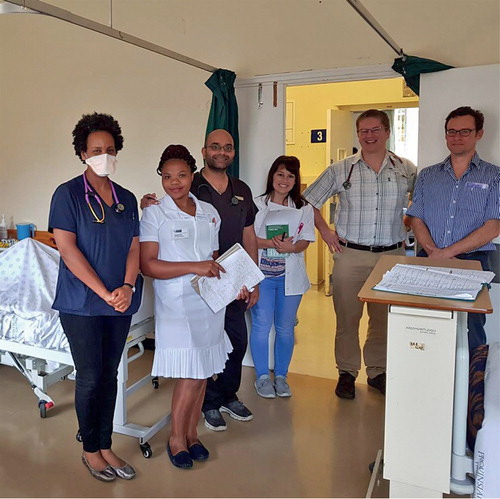
Figure 3: The dedicated antimicrobial prescription chart. Source: SAASP stewardship tools, 2019.Citation19
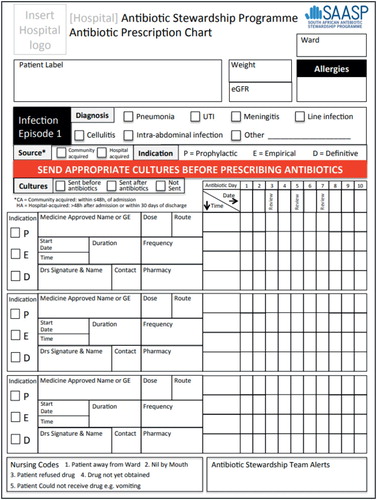
Figure 4: Percentage of patients found to have intravenous lines during the weekly AMS ward rounds at Mossel Bay Hospital. Source: lead author, 2019.
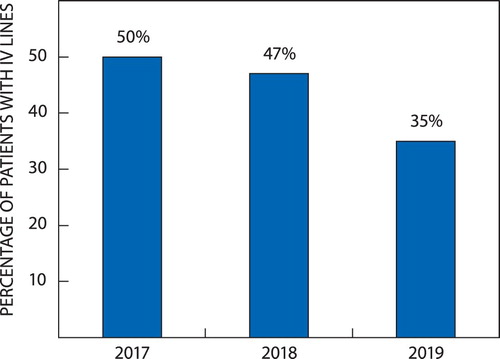
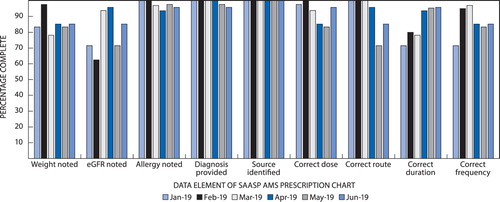
Figure 5: Chart depicting percentages of completed items in the dedicated AMS prescription chart, as captured during the weekly AMS round at Mossel Bay Hospital (number of prescriptions reviewed ranged between 32 and 47 per month). Source: lead author, 2019.