
Figures & data
Table 1. Comparison between the three studied groups according to demographic, clinical and laboratory data.
Figure 1. CAN (red color) against control (green color). (a) Spectra view of CAN against control. (b) Spectra view of peak 12 at the mass 2683. (c) ROC curve peak 12 with m/z 2683 and AUC = 0.991. (d) 2D distribution of peaks (12, 124 with m/z (2683 and 4326 Da).
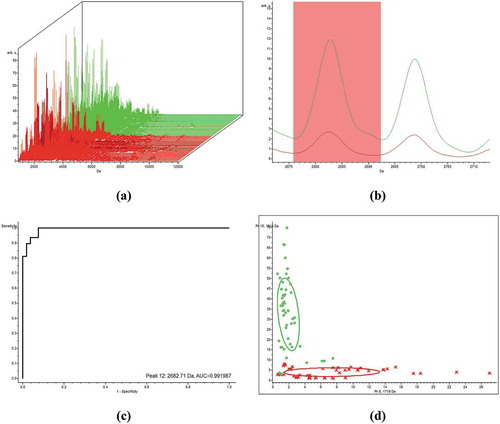
Figure 2. TN (red color) against control (green color). (a) Spectra view of TN against control. (b) Spectra view of peptide peak 21 at the mass 2050. (c) ROC curve of peak 21 with m/z 2050 and AUC = 0.875. (d) 2D distribution of peaks (24, 21) with m/z (2688 and 2051 Da).
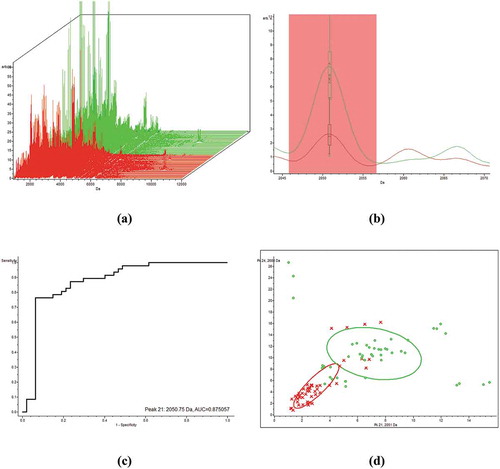
Figure 3. CAN (red color) against TN (green color). (a) Spectra view of CAN against TN. (b) Spectra view of Peak 23. (mass 2926 Da). (c) ROC curve for peak31 with m/z 3739.03 Da and area under the curve (AUC) = 0.705. (d) 2D distribution view of peak 23 and peak 31.
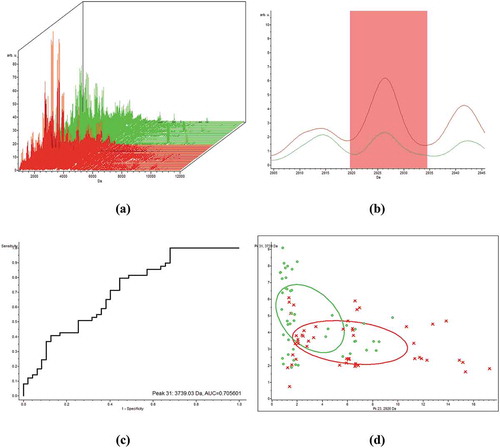
Table 2. Distribution of the studied cases according to different histopathological parameters in CAN group (n = 25).
Table 3. Histopathological findings in CAN biopsies.