Figures & data
Figure 1. Morphological characteristics of ASCs isolated from RAT and LPA. ASCs isolated from RAT (IA-C) and LPA (II D-G). (I) ASCs isolated from RAT shows (a) unmanipulated RAT delivered post operatively. (b) culture on day 7 where few spindle-like cells started to appear (black arrows). (c) culture on day 28, colonies of fibroblast-like cells were formed (black arrowhead). (II) ADSCs isolated from LPA shows (d) LPA material emptied in sterile cups. (e) Culture on day 0 with numerous rounded non-adherent cells (black arrows). (f) Culture on day 3 shows few single adherent spindle fibroblast-like cells (black arrows). (g) culture on day 28 shows several colonies of fibroblast-like cells (black arrowheads). Images were examined by Olympus IMT-2 inverted light microscopy with 10× and 20× magnification
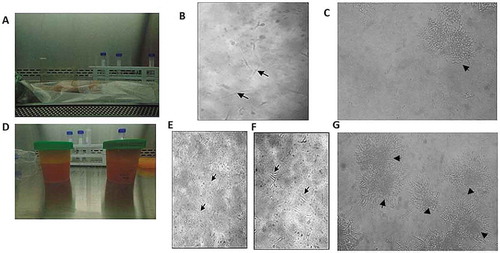
Figure 2. ASCs proliferation study. ASCs proliferation study: (a) ASCs yield was compared between ASCs isolated from LPA (blue histogram) vs RAT (brown histogram) on day 14 and day 28. (b) ASCs fold increase was compared between ASCs isolated from LPA (blue line) vs RAT (brown line) on day 7, 14 and day 28. Data are presented as mean ± SD **p < 0.01, ***p < 0.001
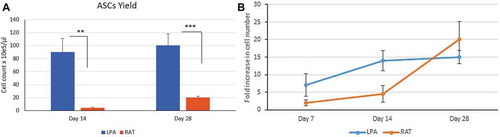
Figure 3. Effect of glucose concentration on ASCs culture. Count of ASCs isolated from LPA cultured in DMEM-high glucose (4.5/L)(blue histogram) vs low glucose (1 g/L) (brown histogram) concentrations at day 7 and 14. *p < 0.05
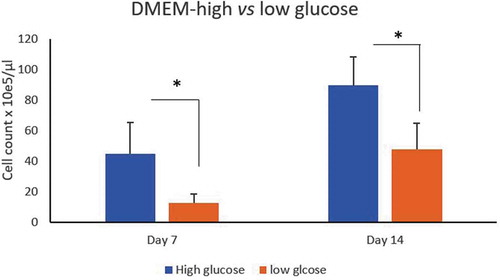
Figure 4. Immunophenotyping of ASCs. A representative results of ASCs surface markers isolated from (a) LPA and (b) RAT as detected by flow cytometry. Histograms for MSCs surface markers; CD49d, CD73 and CD105 expressed as (blue solid histogram) and Isotype IgG as a control (green empty histogram)
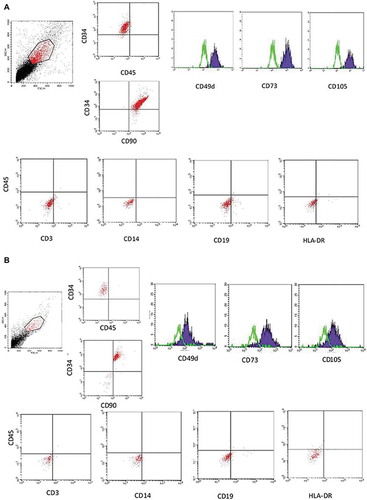
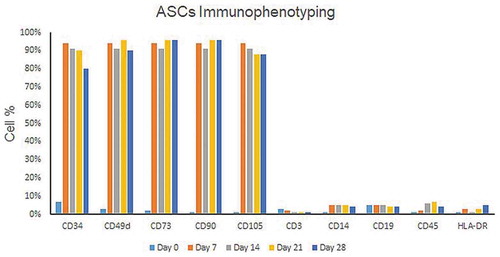
Figure 5. Dynamics of MSCs surface markers expression by ASCs isolated from LPA. Representative bar chart for immunophenotyping of ASCs (isolated from LPA) analyzed by flow cytometry on different timepoints