Figures & data
Table 1. The CT scan results.
Figure 1. Incidental cecal carcinoma discovery in association with acute appendicitis: (A&B) Axial post-contrast (C&D) CMPR showing: An infracecal inflammed appendix (Arrow in A&C), in association with cecal mass (Notched arrow in B&D), together with extensive regional mesenteric fat stranding.
Figure 2. Urgent immediately done CT scan abdomen showing: Acute infracecal appendictis (Arrow in A), while axial (B), coronal reformat (C) and sagittal reformat (D) show infracecal epiploic appendigitis (Notched arrow from B-D).
Figure 3. CT abdomen axial (A, B & C) and sagittal reformat (D), showing anterior right paraumbilical omental inflamed cakelike fatty mass (Arrow), larger than the epiploic appendagitis and lacking the hyperattenuating ring on CT, supporting the diagnosis of omental infarction.
Figure 4. CT scan abdomen axial (A&B) and CMPR (C&D) showing: cystic mucocele due to distal appendiceal dilatation (Arrow in A,b&D) on top of proximal lumen obstruction (Notched arrow in A&C). There is asymmetrical right pelvic raectional lateral conal fascial thickening (Curved arrow in D), adherent to the chronically inflammed appendix.
Figure 5. CT scan arterial phase: (A&B) axial and (C) CMPR of one patient with appendicular calcific (Notched Arrow) enhancing carcinoid tumor (Arrow). (D,E&F) CMPR of another patient with appendicular tip calcific enhancing carcinoid tumor (Notched Arrow) in association with right adrenal avidly enhancing nodule (Arrow) highly suggestive of pheochromocytoma.
Figure 6. (A&B) Axial (C &D) Sagittal contrast Ct scan showing anterior cecal diverticulitis (Arrow in A), posterior cecal diverticula (Notched Arrow), and infracecal normal appendix (Curved Arrow).
Figure 7. CT scan abdomen axial (A-C) and CMPR (D) showing a retroileal partly cystic soft tissue swelling (Arrow in A&B) with a fecolith like calcification. (Arrow in C&D) It was diagnosed as appendicular mass; however, it was surgically and pathologically proven to be NET.
Figure 8. CT scan abdomen axial (A&B) and coronal (C&D) showing terminal ileum stricture (Arrow in A&C), as well as pelvic abscess (Notched Arrow in B&D). Fat planes comb sign (Chevron in C), entrapment of the right ureter is noted at the pelvic inlet with secondary severe hydronephrosis (Arrow in D) and hydroureter (Curved Arrow in A&D).

Figure 9. CT scan abdomen axial (A&B) and coronal (C&D) showing terminal ileum stricture (Arrow in A&C), as well as pelvic abscess (Notched Arrow in B&D). Fat planes comb sign (Chevron in C), entrapment of the right ureter is noted at the pelvic inlet with secondary severe hydronephrosis (Arrow in D) and hydroureter (Curved Arrow in A&D).
Figure 10. CT scan CMPR (A&B) and SMPR (C&D) showing ileocecal intussusception (Arrow) on top of a leading terminal ileal submucous large lipoma (Notched Arrows).
Figure 11. (A&B) showing a right iliac fossa linear dense FB (Arrow in A), with secondary superadded appendicular abscess. (Arrow in B) (C&D) 5 months follow up study revealed the FB (Arrow in C) in close relation to the tip of an inflamed appendix (Notched arrow in D), which is seen originating from the anterior cecal wall.
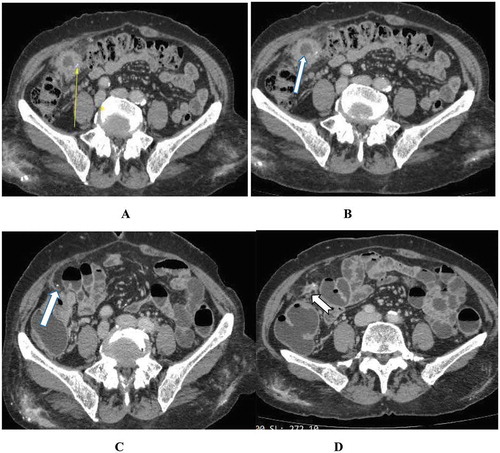
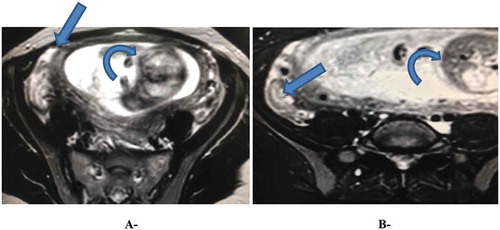
Figure 12. Axial T2 w MRI showing intrauterine fetus (curved arrow), extrauterine small amount of free fluid (Arrow in A), and inflammed appendix (Arrow in B).