
Figures & data
Table 1. The primer sequences used for HPV16 E6/7 mRNA detection [Citation15].
Figure 1. Melting curve of E6.
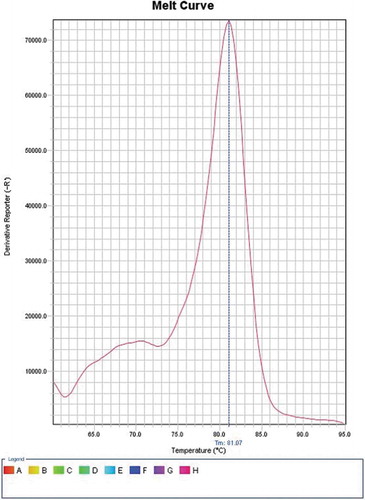
Figure 2. Melting curve of E7.
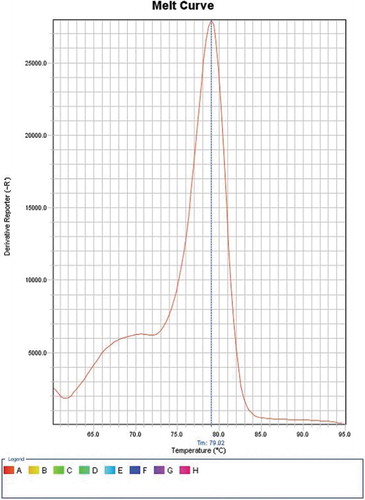
Figure 3. Sites of SCC in the studied patients.
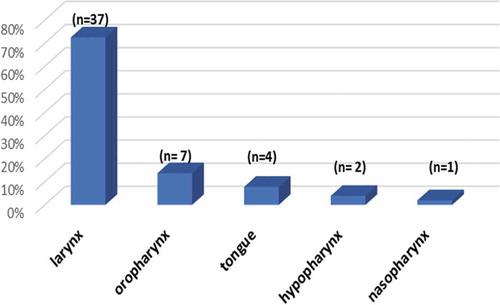
Figure 4. Distribution of tumor stages in the studied cases.
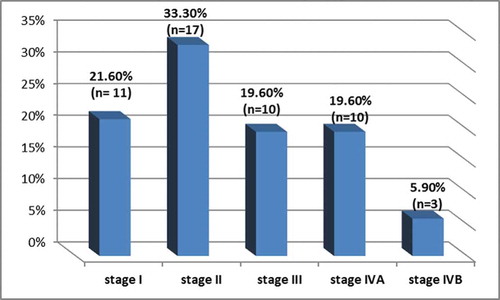
Table 2. Correlation between HPV16 DNA and clinicopathologic variables of the studied patients.
Table 3. Correlation between E6/E7 mRNA and clinicopathologic variables of the studied patients.
Figure 5. A: Photomicrograph showing moderately differentiated non-keratinized squamous cell carcinoma [H&E, magnification x200], B: Photomicrograph showing negative staining of p16 of the same case [p16-INK4a, original magnification x200].
![Figure 5. A: Photomicrograph showing moderately differentiated non-keratinized squamous cell carcinoma [H&E, magnification x200], B: Photomicrograph showing negative staining of p16 of the same case [p16-INK4a, original magnification x200].](/cms/asset/17e44841-b800-450a-8e3e-d7ab8896a840/tajm_a_1827944_f0005_oc.jpg)
Figure 6. A: Photomicrograph showing moderately differentiated keratinized squamous cell carcinoma [H&E, original magnification x400], B: Photomicrograph showing positive cytoplasmic p16 staining via IHC of the same case [p16-INK4a, magnification x400].
![Figure 6. A: Photomicrograph showing moderately differentiated keratinized squamous cell carcinoma [H&E, original magnification x400], B: Photomicrograph showing positive cytoplasmic p16 staining via IHC of the same case [p16-INK4a, magnification x400].](/cms/asset/d36ba2a5-6c4f-459e-97e6-fb95fd925e28/tajm_a_1827944_f0006_oc.jpg)
Table 4. Correlations between p16 and clinicopathologic variables of the studied patients.
Data availability
All datasets generated or analyzed during this study are included in the manuscript.