
Figures & data
Figure 1. Photomicrographs of the renal cortex sections stained by hematoxylin and eosin: (A) Control group showing renal corpuscle with glomerulus (G), the parietal layer of Bowman’s capsule consists of a layer of flat cells (arrow), Bowman’s space(S). The proximal convoluted tubules (P) with cuboidal cells lining, narrow lumen and deeply stained cytoplasm. Distal convoluted tubules (D) with a wider lumen, cuboidal cells, rounded central nuclei and the cytoplasm is pale. (B) Gentamicin treated group showing shrunken glomerulus (G) and dilated renal space(S). Cells of both proximal (P) and distal (D) convoluted tubules showing vacuolated cytoplasm (v), most of them with pyknotic nuclei (arrowhead). Desquamated cells can be observed in the tubular lumen (arrows). Note the presence of empty spaces(e)and mononuclear cellular infilteration (I). (C) Gentamicin and AGE cotreated group showing apparently normal renal cortex,glomerulus(G), some cells show vacuolations of cytoplasm (v) most of the cells have vesicular nuclei (arrows). (Hx & E x400)
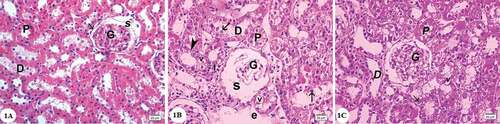
Figure 2. Photomicrographs of Masson’s Trichrome stained renal cortex sections: (A) Control group showing minimal collagen fiber deposition in the renal corpuscles and in between renal tubules (arrows). (B) Gentamicin treated group showing intense collagen fiber deposition in the renal corpuscles and in between proximal and distal convoluted tubules (arrows). (C) Gentamicin and AGE cotreated group showing little collagen fiber deposition in the renal corpuscles and in between renal tubules (arrows). (Masson’s Trichrome x 400)
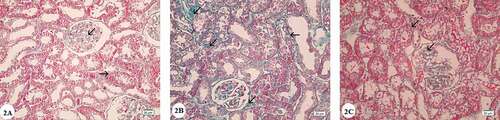
Figure 3. Photomicrographs of semithin sections of the renal cortex: (A) Control group showing lining endothelium(e) of glomerular capillaries (C) invested by podocytes with pale stained cytoplasm and nuclei (arrow), mesangial cells(m)surrounded by deeply stained mesangial matrix (*). Note the renal space (s) between parietal (arrowhead) and visceral layers of Bowman’s capsule, (P) Proximal and (D) distal convoluted tubules. (B) Gentamicin treated group showing hyperplasia of mesangial cells (m), congested capillaries(c) and thickening of the parietal layer of Bowman’s capsule (arrow). Inset showing destructed renal glomerulus (G). (C) Gentamicin and AGE cotreated group showing preservation of renal corpuscle structure with nearly normal glomerulus(G). (Toluidine blue x1000)
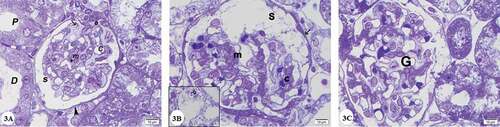
Figure 4. Photomicrographs of renal cortex semithin sections: (A) Control group showing lining cells of proximal convoluted tubules (P) which are cuboidal and have rounded vesicular nuclei, apical prominent brush borders (*) and clear basal striations (arrowhead). Distal convoluted tubules (D) have cuboidal cell lining with rounded nuclei and paler cytoplasm. (B) and (C) Gentamicin treated group:(B) showing that the lining cells of proximal (P) and distal (D) convoluted tubules with vacuolated cytoplasm (v), many deeply stained lysosomes (arrow heads) pyknotic nuclei (arrow) marked loss of brush border (*). Desquamated cells in the lumen (double arrow) are noticed. Note interstitial cellular infiltrate (I). (C) showing loss of lining cells of some tubules (arrow). (D) Gentamicin and AGE cotreated group showing that most of the cells lining proximal convoluted tubules (P) and distal convoluted tubules (D) have rounded vesicular nuclei. Brush border is preserved (*) Some cells have vacuolated cytoplasm(v). (Toluidine blue x1000)
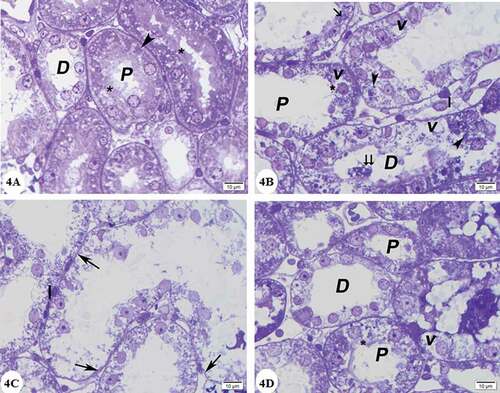
Figure 5. Photomicrographs of immunohistochemically stained sections for caspase −3 of the renal cortex: (A) Control group showing negative cytoplasmic reactions for caspase-3 in the cells of renal tubules (arrow) (B) Gentamicin treated group showing widespread cytoplasmic immunoreactivity reactions for caspase-3 (arrows). (C) Gentamicin and AGE cotreated group showing weak cytoplasmic reactions for caspase-3 (arrow). (caspase-3 immunostaining x400)
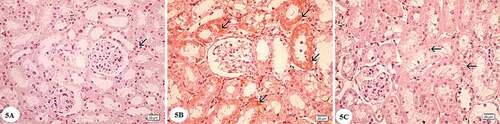
Figure 6. Electron micrographs of a portion of renal corpuscle: (A) and (B) Control group showing capillary in the glomerulus (C) with fenestrated endothelium lining (arrow) with uniform lamina densa bordered on each side with lamina rara (*), red blood cell(R). Podocyte cell (Po) with folded nucleus(N) gives primary process (p1) and numerous secondary processes (p2) separated by filtration slits. Note mesangial cell surrounded by mesangial matrix (ms). (C) and (D) Gentamicin treated group showing the capillary in a glomerulus (C) that is lined with distorted endothelium (arrow heads) with irregular thickening of the basement membrane (*), distorted secondary processes of podocytes (p2). Note electron dense mesangial matrix (ms). (E) Gentamicin and AGE cotreated group demonstrating glomerular capillary (C) with fenestrated endothelium (arrowhead). Note the presence of more or less normal basement membrane structure (*) and secondary processes of podocytes (p2) separated by filtration slits, podocyte (Po) and mesangial matrix (ms). (x 4800)
Figure 7. Electron micrographs of a portion of the proximal convoluted tubule: (A) Control group showing that the cell has an euchromatic nucleus (N) with prominent nucleolus, basal infoldings of the cell (arrow) with longitudinally arranged mitochondria (M), apical microvilli (mv), and apical vacuoles (v). (B) Gentamicin treated group showing the cell has a small condensed nucleus (N), loss of basal infoldings, mitochondria (M) with distorted cristae and matrix loss, loss of apical microvilli (mv), the cytoplasm shows the presence of many lysosomes (L) and vacuoles(*). (C) Gentamicin and AGE cotreated group showing that the cell has an euchromatic nucleus (N) with, basal infoldings of the cell (arrow) with mitochondria(M), apical microvilli (mv) and some vacuoles(v) can be noticed (x 4800)
Figure 8. Electron micrographs of a portion of the distal convoluted tubule: (A) Control group showing that the cell has an euchromatic nucleus (N), basal infoldings of the cell (arrows) with longitudinally arranged mitochondria (M), few apical blunt microvilli (arrowhead). (B) Gentamicin treated group showing that the cell has condensed nucleus (N), the cytoplasm(c) appears rarified with many vacuoles and loss of basal infoldings (arrow) and most of cytoplasmic organelles. . (C) Gentamicin and AGE cotreated group showing that the cell has an euchromatic nucleus (N), mitochondria (M) and some vacuoles(v) in the cytoplasm could be seen. (x 4800)
Table 1. Showing the mean area percentage ± SE of collagen fibers deposition in all experimental groups(n = 5)
Table 2. Showing the mean area percentage ±SE of caspase-3 immunostaining in all experimental groups(n = 5)