
Figures & data
Table 1. Comparison between the two studied groups according to socio-demographic and anthropometric data
Table 2. Comparison between the two studied groups according to clinical and laboratory data
Table 3. Comparison between the two studied groups according to serum insulin level, insulin sensitivity, and serum selenoprotein P level
Figure 1. Comparison between the two studied groups according to serum selenoprotein P concentration
Table 4. Cut-off point for serum selenoprotein P concentration (mg/L) to predict insulin resistance in the total sample
Figure 2. ROC curve for Serum selenoprotein P concentration (mg/L) to predict insulin resistant in total sample
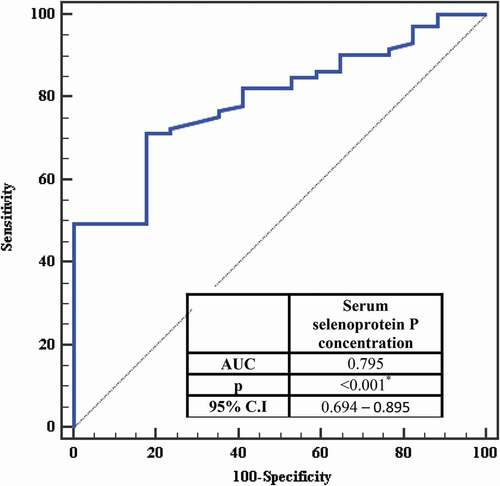
Table 5. Cut-off point for visceral adiposity index to predict insulin resistance in the total sample
Figure 3. ROC curve for visceral adiposity index to predict insulin resistant in total sample
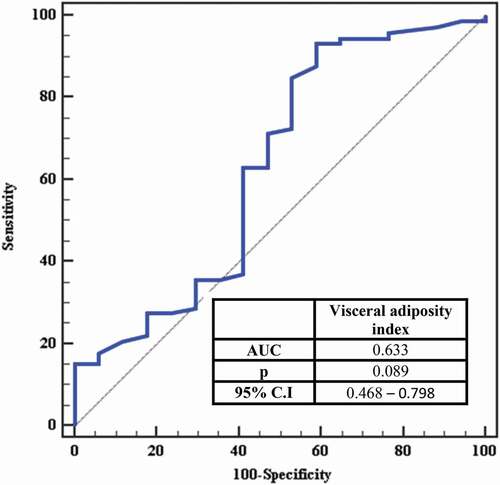
Table 6. Correlation between serum selenoprotein P concentration different parameters in each group
Table 7. Univariate and multivariate analysis for the parameters affecting Serum selenoprotein P concentration in overweight/obesity (n = 50)