
Figures & data
Table 1. Spectrum and frequencies of findings among patients with dyspepsia who underwent oesophago-gastro-duodenoscopy
Figure 1. Age group distribution of patients with dyspepsia who underwent oesophago-gastro-duodenoscopy
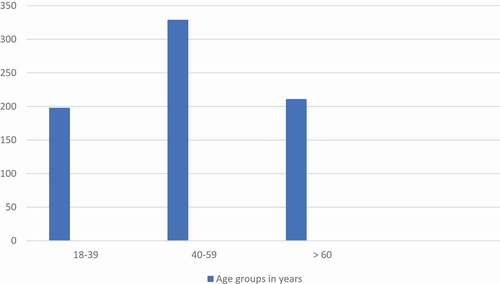
Table 2. Relationship between the demographic parameters of the patients and the findings in the different parts of the upper gastrointestinal tracts