
Figures & data
Figure 1. Flow-chart diagram for plan of study
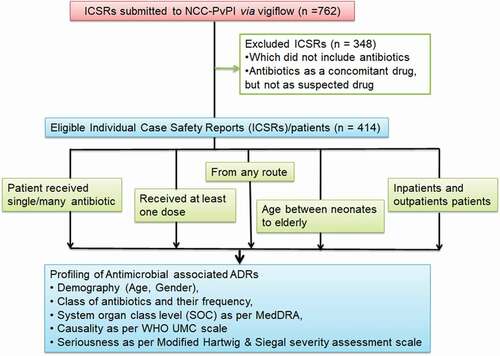
Table 1. Analysis of demographic, and causality of adverse drug reactions (ADRs)
Table 2. Individual drug frequency reported in individual case safety reports [(ICSRs) n = 414].a
Table 3. Antimicrobial-associated adverse drug reactions (ADRs) involved in skin and subcutaneous tissue (SOC).a.
Table 4. Antimicrobial-associated adverse drug reactions (ADRs) involved in different system organ class (SOC).a.
Figure 2. System organ class (SOC) involved in adverse drug reactions (ADRs)
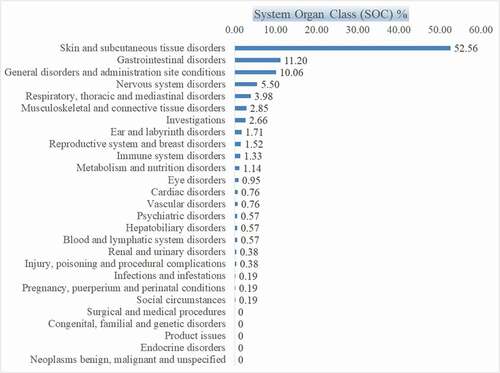
Table 5. Severity of adverse drug reactions (ADRs) as per modified Hartwig and Siegel severity assessment scale