Figures & data
Table 1. General characteristics of the population.
Table 2. Distribution of the population by age of food diversification.
Table 3. Parent’s and patient’s BMI.
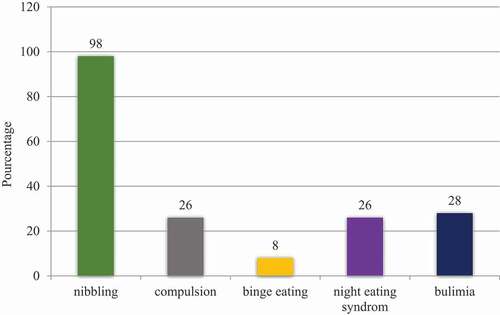
Table 4. Composition of nibbling.
Table 5. Food survey results.
Register now or learn more
Open access
People also read lists articles that other readers of this article have read.
Recommended articles lists articles that we recommend and is powered by our AI driven recommendation engine.
Cited by lists all citing articles based on Crossref citations.
Articles with the Crossref icon will open in a new tab.