Figures & data
Table 1. Primers used for amplification of antioxidant enzyme genes.
Figure 1. Effect of EGCG on selected oxidative stress markers. (a): MDA levels, (b): Protein carbonyls. Results were analyzed using one way ANOVA and expressed as mean ± SD. In first level of comparison, Turkey’s multiple comparisons test was used to compare the mean of the control group with mean of every other group at confidence level of 95%. Bars with letter a were not statistically different against the control (p > 0.05). In second level of comparison using the same test, the mean of Ethanol group was compared with EGCG + Ethanol group. Bar with letter ac was statistically different against ethanol group (p < 0.05).
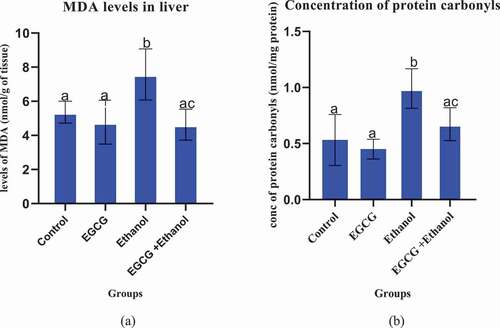
Figure 2. Effect of EGCG on selected serum markers of ethanol induced liver damage in mice. (a): ALT, (b) AST, and (c) Total serum protein. Results were analyzed using one way ANOVA and expressed as mean ± SD. In the first level of comparison, Turkey’s multiple comparisons test compare the mean of control group with the mean of every other group at confidence level of 95%. All bars with letter a were not statistically different against the control (p > 0.05). In the second level of comparison using the same test at the same confidence level, the mean of Ethanol group was compared with the mean of EGCG + Ethanol group. Bar with letter ac is statistically different against ethanol group (p < 0.05).
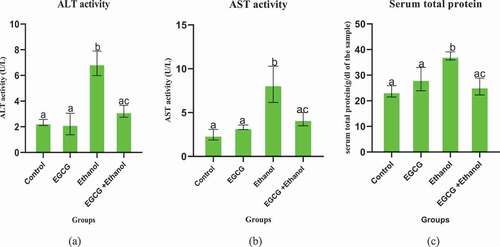
Figure 3. Histological micrographs for Control group (a), EGCG group (b), Ethanol induced group (c) and EGCG + Ethanol group (d). Magnification X40.
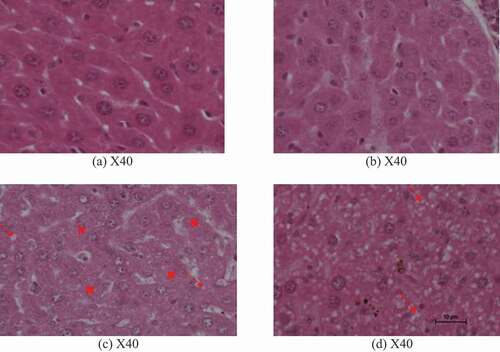
Figure 4. Effect of EGCG on activity of enzymatic antioxidant markers of ethanol induced liver damage. (a) SOD and (b): CAT. Results were analyzed using one way ANOVA and expressed as mean ± SD. In the first level of comparison using Turkey’s multiple comparisons test at confidence level of 95%, mean of the control group was compared with the mean of every group: All bars with letter a were not statistically different against the control (p > 0.05). In the second level of comparison, mean of ethanol group was compared against mean of EGCG + Ethanol group. Bar with letter ac was statistically different against ethanol treated mice (p < 0.05).
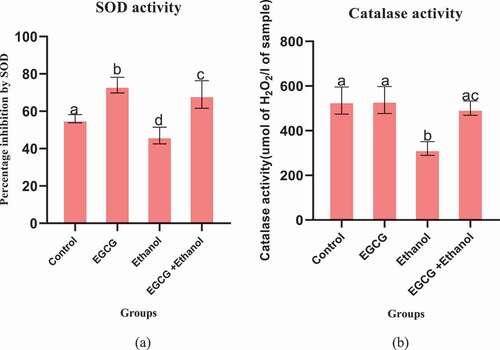
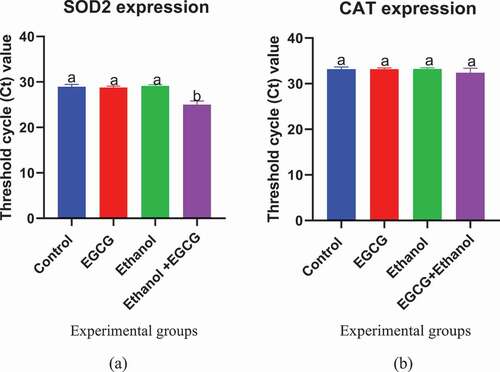
Figure 5. Effect of EGCG on expression of (a) SOD-2 and (b) CAT genes using 0.06 as baseline. Results were analyzed using one way ANOVA and expressed as mean ± SD. Turkey’s multiple comparisons test at confidence level of 95% was used to compare mean of each group with mean of every other group. Bars with different letters were statistically different (p < 0.05). Bars with the same letters are not statistically different (p < 0.05).