Figures & data
Table 1. Socio-demographic characteristics of study participants (N = 5394).
Table 2. Vaccination history of study participants according to nationality (N = 5394).
Figure 1. Participants response regarding COVID-19 vaccination; 27.5% were vaccinated, 37.1% reported that they refuse the vaccination and 35.4% intend to take the COVID-19 vaccine at time of the study.
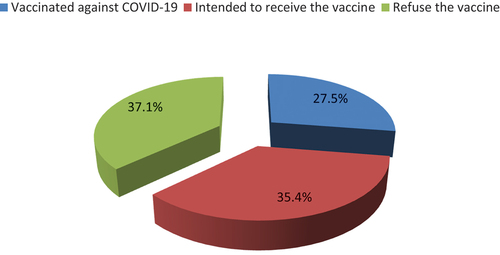
Table 3. (a): Factors against COVID-19 vaccination among refusing participants according to nationality (n = 2000): perceived susceptibility and complications and perceived benefit (concerns about vaccine effectiveness).
Table 4. (a): Reasons for COVID-19 vaccine acceptance according to nationality among those accepted vaccination (n = 3394): perceived susceptibility and complications and perceived benefit.
Table 5. Relationship between respondents’ socio-demographic characteristics and vaccine acceptance.
Table 6. Factors associated with vaccine acceptance among participants.
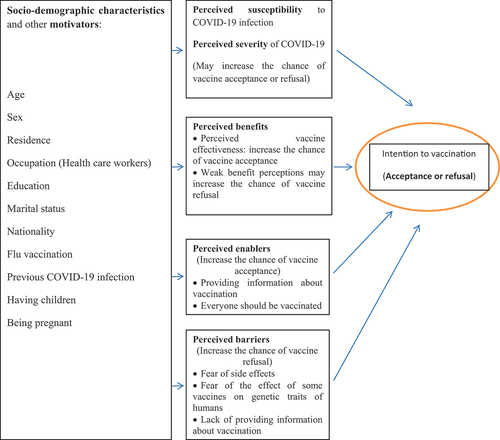
Figure 2. Main study findings in the context of the conceptual framework proposed by Burke et al., 2021 after making some modifications. This conceptual framework is originaly fromulated from the Health Belief Model (HBM).