
Figures & data
Table 1. Comparison between survivors and non-survivors regarding baseline characteristics.
Table 2. Correlation between EEG grading with length of ICU stay, need for mechanical ventilation, need for vasopressors and CPC score in total patients (n = 80).
Figure 1. ROC curve for different parameters to predict 28-day mortality (n = 32 vs. 48).
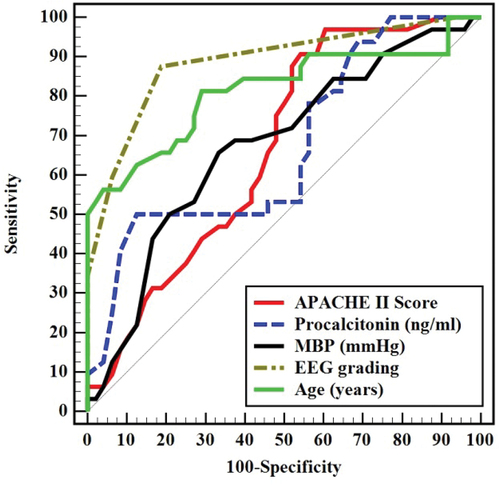
Table 3. Univariate logistic regression analysis for the parameters affecting 28-day mortality (n = 32 vs. 48): (fig.1).
Table 4. Prognostic performance for different parameters to predict 28-day mortality (n = 32 vs. 48).