
Figures & data
Table 1. Comparison between the two studied groups according to demographic, clinical, and laboratory characteristics.
Table 2. Comparison between the two studied groups according to the angiographic results.
Figure 1. Shows EAT thickness of 3.07 mm in one STEMI patients with angiographically high thrombus burden.
Figure 2. ROC curve that predict EAT thickness cutoff value of 2.48 mm to predict high thrombus burden in STEMI patient.
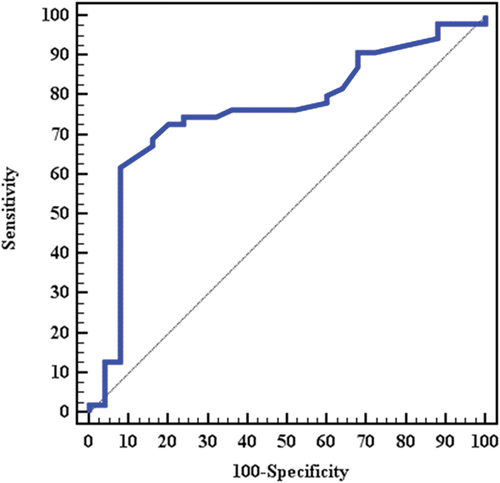
Table 3. Comparison between the two studied groups according to echocardiographic results.
Table 4. Univariate logistic regression of different parameters to predict the thrombus burden in STEMI patients undergoing PPCI.