
Figures & data
Table 1. Comparison between the different studied periods according to S.Creatinine (n = 10).
Table 2. Comparison between the two studied groups according to GFR.
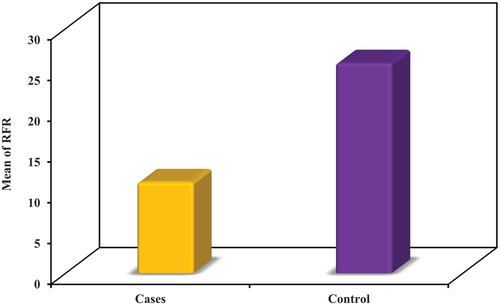
Table 3. Comparison between the two studied groups according to RFR.
Figure 1. Comparison between the different studied periods according to S.Creatinine (n = 10).
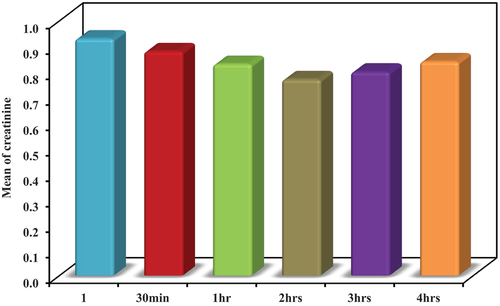
Figure 2. Comparison between the two studied groups according to GFR.
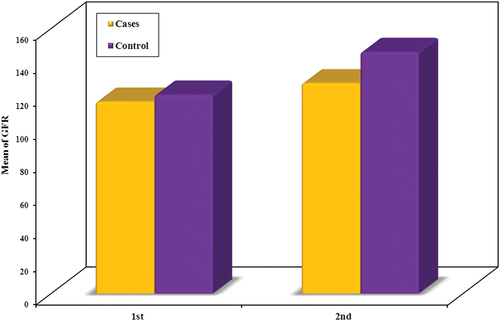
Figure 3. Comparison between the two studied groups according to RFR.
Supplemental material