
Figures & data
Proliferative lupus nephritis patients included in the study.
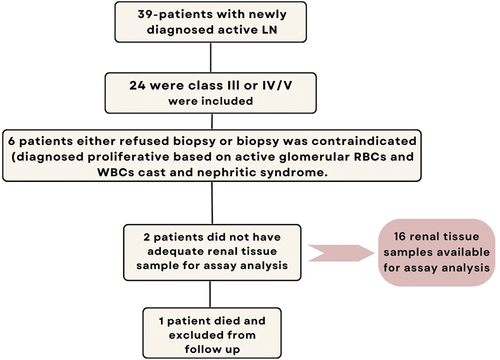
Table 1. Baseline demographic and clinical characteristics of the studied active proliferative LN patients.
Table 2. Baseline clinical data and laboratory measures of the studied LN patients.
Table 3. Histopathological characteristics of the taken renal biopsies at baseline (n = 18).
Figure 1. Difference in BAFF expression levels in PBMCs and renal tissues in responders and non-responders.
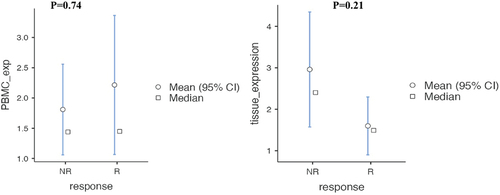
Table 4. Difference in BAFF expression levels in PBMCs and renal tissues in responders and non-responders.
Table 5. Correlation between both PBMC and tissue BAFF expression and 6-month follow-up parameters.