
Figures & data
Figure 1. An example of two sets of urodynamic trace for the same patient. (A) Multi-channel trace with Pdet (light blue), Pves (blue), Pabd (red), flow (green). (B) Single-channel Pves trace obtained by removing Pabd.
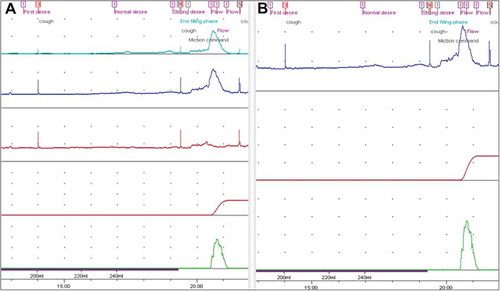
Table 1. Demographic data.
Table 2. Comparison of interpretation of compliance and DO between single- and multi-channel studies.
Table 3. Breakdown of children in each category who were included for analysis of voiding pressures.