
Figures & data
Table 1. Socio-Demographic profile of the participants (n = 869).
Table 2. Tumour profile.
Figure 1. (a) Incidence of testicular cancer In Saudi Arabia over the years per 100,000. (b) Incidence of testicular cancer in Saudi Arabia over the years.
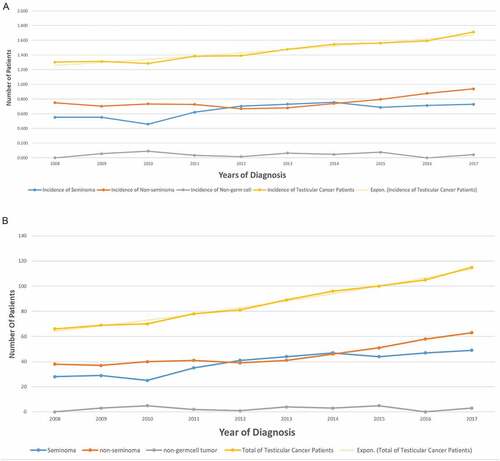
Figure 2. (a) Survival analysis according to the age groups (b) Survival analysis according to the Histopathology Groups. (c) Survival analysis according to the histopathological subtypes (d) Survival analysis according to the tumor stage.
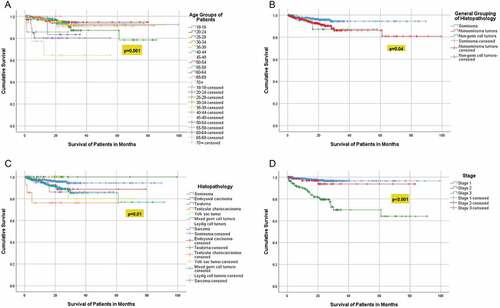
Figure 3. Association between histopathology groups (non-germ cell tumors, seminoma, nonseminoma tumors) and age (in years).
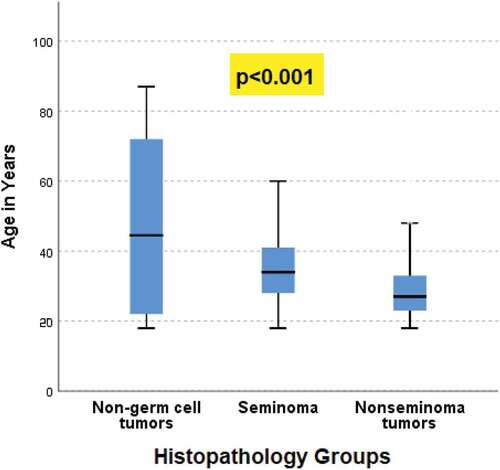
Figure 4. Association between histopathology groups (seminoma, nonseminoma tumors, non-germ cell tumors) and age groups (in years).
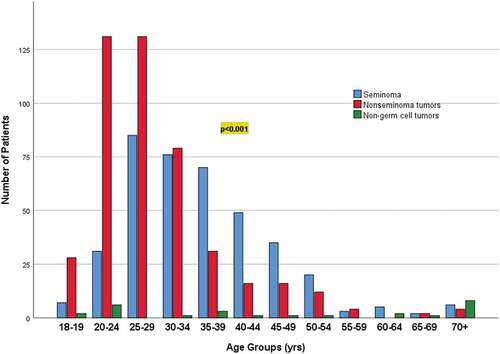
Table 3. Kaplan–Meier survival analysis across different factors.
Table 4. Deceased versus alive according to the stage of tumor.