Figures & data
Figure 1. PRISMA diagram of the detailed process of selection of studies for inclusion in the systematic review and meta-analysis.
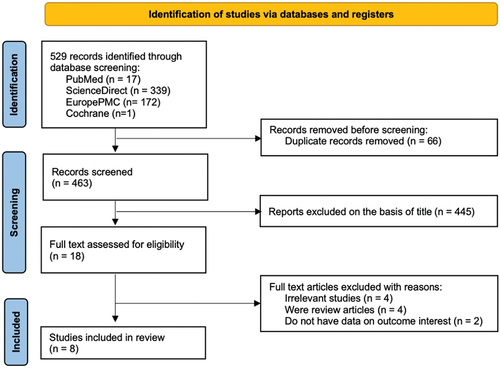
Table 1. Characteristics of the included studies.
Table 2. Newcastle-Ottawa quality assessment of observational studies.
Figure 2. Forest plot demonstrating the adjusted hazard ratio for low albumin–globulin ratio (AGR) vs high AGR for predicting the overall survival (OS) (a), and cancer-specific survival (CSS) (b) outcomes..
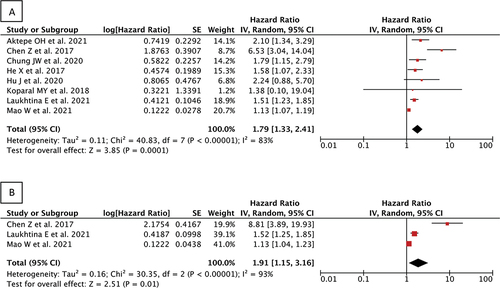
Figure 3. Funnel plot for the adjusted hazard ratio for low albumin-globulin ratio (AGR) vs high AGR for predicting the overall survival (OS) (a), and cancer-specific survival (CSS) (b) outcomes.
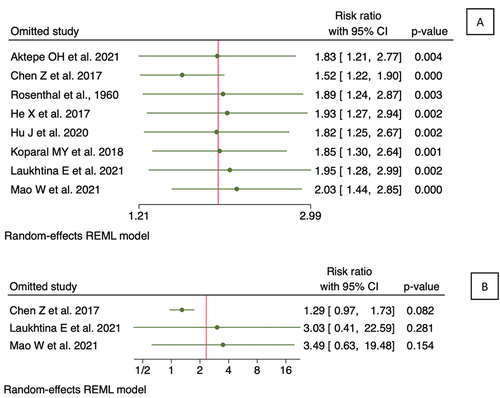
Figure 4. Sensitivity analysis using leave-one-out plot of included studies in predicting the overall survival (OS) (a), and cancer-specific survival (CSS) (b) outcomes.