Figures & data
Figure 1. Geological map of southern Kebbi
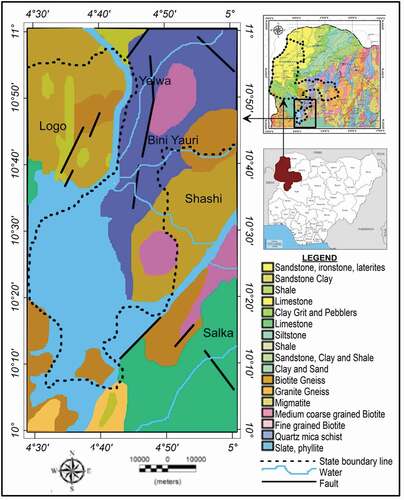
Table 1. Radioelement contents of some rock types and minerals (extracted from Dickson and Scott Citation1997; International Atomic Energy Agency (IAEA) Citation2003; Dentith and Mudge Citation2014)
Figure 2. Total magnetic intensity map
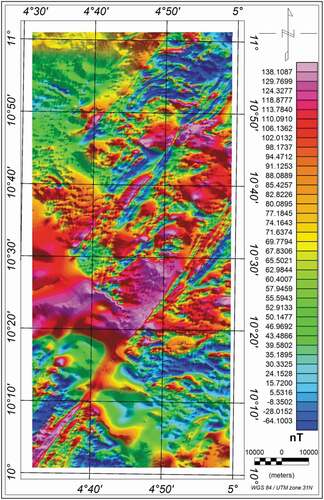
Figure 3. Reduced to equator magnetic map
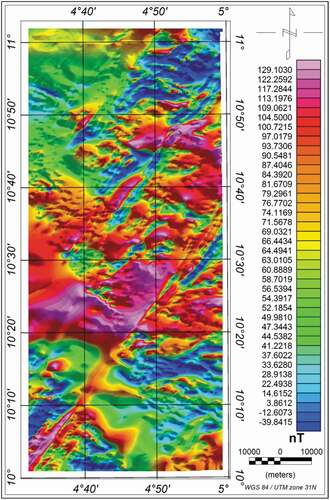
Figure 4. Residual magnetic (intensity) map
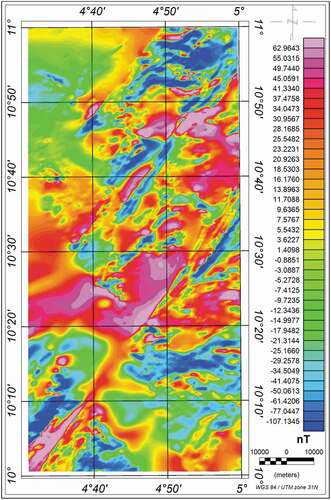
Figure 5. Analytic signal magnetic map
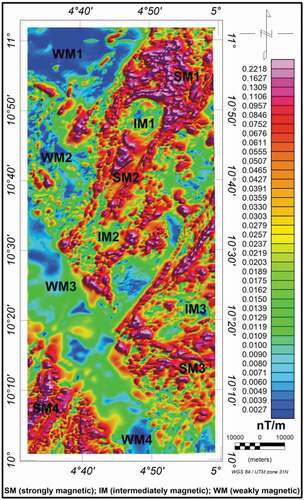
Figure 6. First vertical derivative magnetic map
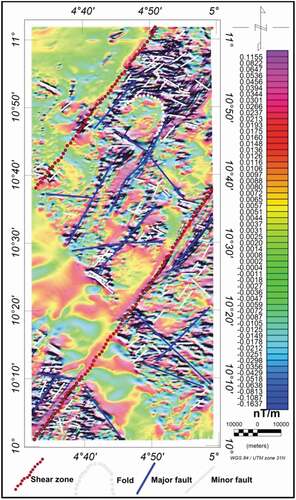
Figure 7. Structural map derived from magnetic interpretation
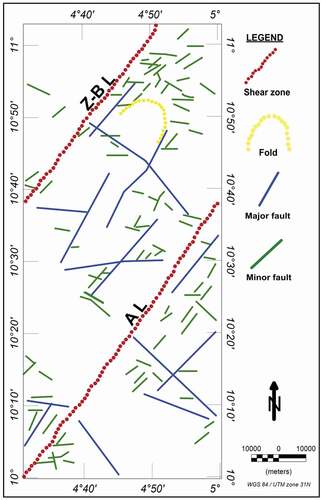
Figure 8. Euler solutions map
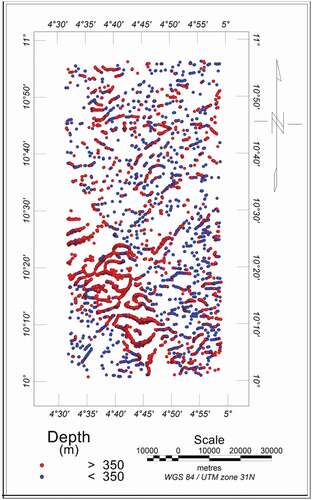
Figure 9. Potassium concentration map
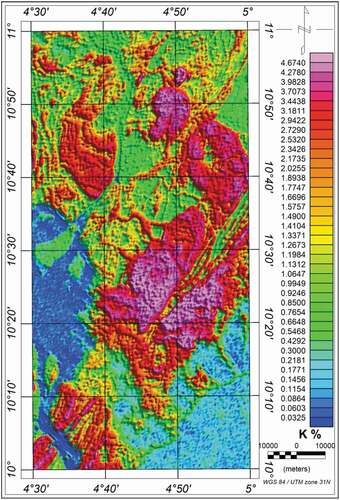
Figure 10. Thorium concentration map
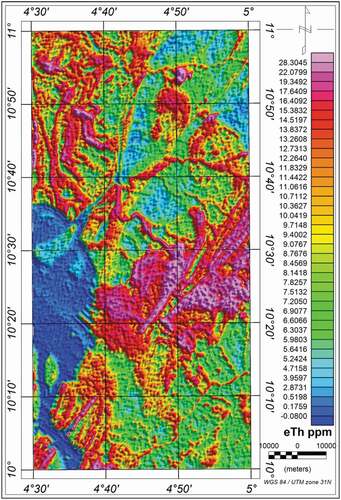
Figure 11. Uranium concentration map
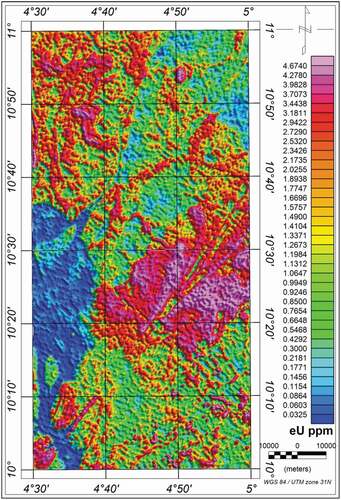
Figure 12. Potassium-to-thorium ratio map
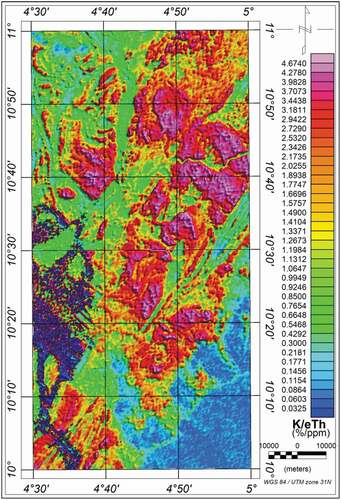
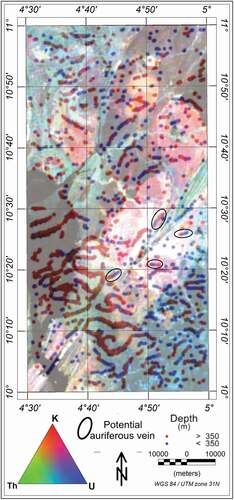
Figure 13. Ternary map
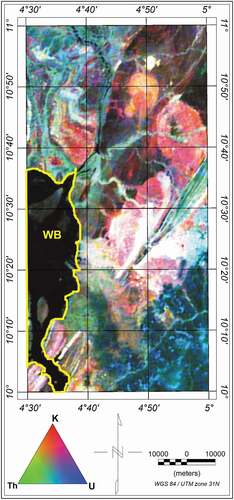
Figure 14. Radiolithic map
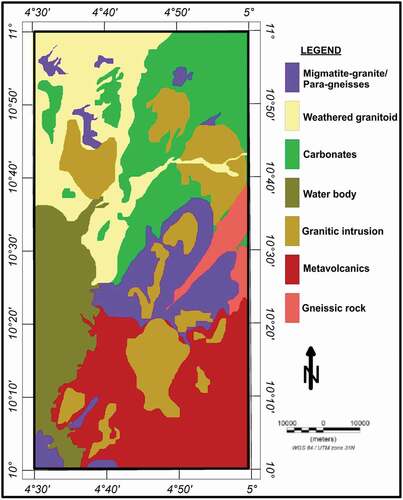
Figure 15. Depth profile of the area
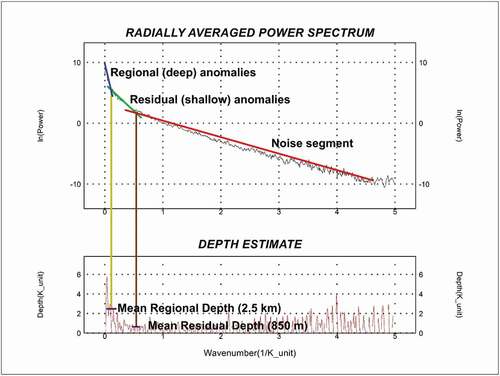
Figure 16. Geophysical classification map
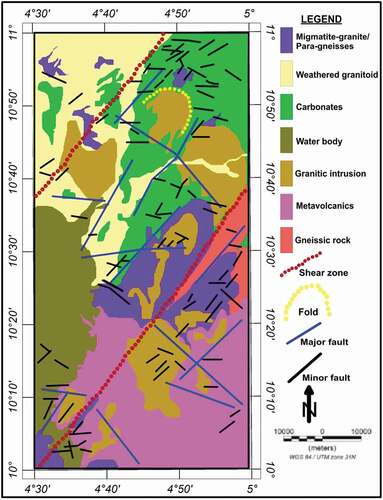
Figure 17. Euler solutions superimposed on ternary image